| Issue |
A&A
Volume 563, March 2014
|
|
|---|---|---|
| Article Number | L2 | |
| Number of page(s) | 10 | |
| Section | Letters | |
| DOI | https://doi.org/10.1051/0004-6361/201323033 | |
| Published online | 25 February 2014 | |
First results from the CALYPSO IRAM-PdBI survey
II. Resolving the hot corino in the Class 0 protostar NGC 1333-IRAS2A⋆,⋆⋆,⋆⋆⋆,⋆⋆⋆⋆
1 Harvard-Smithsonian Center for Astrophysics, 60 Garden street, Cambridge, MA 02138, USA
e-mail: amaury@cfa.harvard.edu
2 ESO, Karl Schwarzschild Strasse 2, 85748 Garching bei München, Germany
3 Max-Planck-Institut für Radioastronomie, Auf dem Hügel 69, 53121 Bonn, Germany
4 Laboratoire AIM-Paris-Saclay, CEA/DSM/Irfu – CNRS – Université Paris Diderot, CE-Saclay, 91191 Gif-sur-Yvette, France
5 UJF-Grenoble1/CNRS-INSU, Institut de Planétologie et d’Astrophysique de Grenoble, UMR 5274, 38041 Grenoble, France
6 IRAM, 300 rue de la Piscine, 38406 St Martin d’Hères, France
7 INAF – Osservatorio Astrofisico di Arcetri, Largo E. Fermi 5, 50125 Firenze, Italy
8 LERMA, CNRS UMR 8112, Observatoire de Paris, ENS, UPMC, UCP, PSL, 75014 Paris, France
9 Excellence Cluster Universe, Boltzmannstr. 2, 85748 Garching, Germany
10 Université de Bordeaux, LAB, UMR 5804, 33270 Floirac, France
11 CNRS, LAB, UMR 5804, 33270 Floirac, France
Received: 12 November 2013
Accepted: 22 January 2014
Aims. We investigate the origin of complex organic molecules (COMs) in the gas phase around the low-mass Class 0 protostar NGC 1333-IRAS2A, to determine if the COM emission lines trace an embedded disk, shocks from the protostellar jet, or the warm inner parts of the protostellar envelope.
Methods. In the framework of the CALYPSO IRAM Plateau de Bure survey, we obtained large bandwidth spectra at sub-arcsecond resolution towards NGC 1333-IRAS2A. We identify the emission lines towards the central protostar and perform Gaussian fits to constrain the size of the emitting region for each of these lines, tracing various physical conditions and scales.
Results. The emission of numerous COMs such as methanol, ethylene glycol, and methyl formate is spatially resolved by our observations. This allows us to measure, for the first time, the size of the COM emission inside the protostellar envelope, finding that it originates from a region of radius 40–100 AU, centered on the NGC 1333-IRAS2A protostellar object. Our analysis shows no preferential elongation of the COM emission along the jet axis, and therefore does not support the hypothesis that COM emission arises from shocked envelope material at the base of the jet. Down to similar sizes, the dust continuum emission is well reproduced with a single power-law envelope model, and therefore does not favor the hypothesis that COM emission arises from the thermal sublimation of grains embedded in a circumstellar disk. Finally, the typical scale ~60 AU observed for COM emission is consistent with the size of the inner envelope where Tdust > 100 K is expected. Our data therefore strongly suggest that the COM emission traces the hot corino in IRAS2A, i.e., the warm inner envelope material where the icy mantles of dust grains evaporate because they are passively heated by the central protostellar object.
Key words: stars: formation / circumstellar matter / ISM: individual objects: NGC 1333-IRAS2A / radio lines: ISM / methods: observational
Based on observations carried out with the IRAM Plateau de Bure Interferometer. IRAM is supported by INSU/CNRS (France), MPG (Germany), and IGN (Spain).
Appendix A, Tables 1, 2, and Figs. 3, 4 are available in electronic form at http://www.aanda.org
The integrated emission maps shown in Fig. 3 are available in electronic form at the CDS via anonymous ftp to cdsarc.u-strasbg.fr (130.79.128.5) or via http://cdsarc.u-strasbg.fr/viz-bin/qcat?J/A+A/563/L2
© ESO, 2014
1. COM emission in Class 0 protostars
Along the path leading to the formation of solar-type stars, the Class 0 phase is the main accretion phase during which most of the final stellar mass is accreted onto the central protostellar object (André et al. 2000). It is therefore of paramount importance to study the properties of the infalling envelope material on all scales during the Class 0 phase. Ultimately, this will allow us to constrain the efficiency of the accretion/ejection process to build solar-type stars and to shed light on the initial conditions for the formation of protoplanetary disks and planets around stars like our own. However, on the small scales (≲50–200 AU) where protostellar disks (progenitors of the protoplanetary disks observed at later stages) are assembled during the embedded phases, most envelope tracers (e.g., 12CO, N2H+) are optically thick or chemically destroyed, making it difficult to probe the physical properties of the inner envelope on scales where accretion actually proceeds.
The origin of complex organic molecule (COM) emission in low-mass Class 0 protostars is still debated (Bottinelli et al. 2007). First, it has been suggested that the emission of COMs comes from hot corino regions deeply embedded in Class 0 protostars, analogous to the hot cores observed towards high-mass protostars (e.g., van Dishoeck & Blake 1998; Ceccarelli 2004; Bottinelli et al. 2004a). In its early stages, the central protostellar object radiatively heats the surrounding inner envelope. When the temperature of the envelope material becomes high enough (~100 K), the icy mantles of dust grains evaporate, leading to high gas-phase abundances of complex organic molecules that are formed on dust grains (Cazaux et al. 2003; Ceccarelli 2007; Garrod et al. 2008). Because of the low luminosities of the central protostars, the region where these molecules are released is expected to be small (typically ≲200 AU in diameter; Bottinelli et al. 2004b). If the COM emission indeed traces the warm inner envelope heated by the central protostellar object, COM lines could be good candidates to study the infall and accretion of circumstellar material down to the very vicinity of the protostellar object itself. However, it has also been proposed that COM emission could originate from the warm surface of embedded disks (Jørgensen et al. 2005b), or shocked material along protostellar jets, since species such as CH3OH are known to be greatly enhanced in shocks (Bachiller & Perez Gutierrez 1997; Chandler et al. 2005) as a result of grain mantle sputtering.
The CALYPSO survey1, carried out with the IRAM Plateau de Bure (PdBI) interferometer, is providing us with detailed, extensive observations of 17 Class 0 protostars between 92 GHz and 232 GHz. One of the main goals of this ambitious observing program is to understand how the circumstellar envelope is being accreted onto the central protostellar object during the Class 0 phase. Here, we show that our broad band CALYPSO observations of the Class 0 protostar NGC 1333-IRAS2A (d ~ 235 pc; Hirota et al. 2008) provide direct imaging of numerous emission lines, spatially resolving the COM emission structure and therefore putting strong constraints on its origin.
2. Observations and data reduction
The Class 0 protostar NGC 1333-IRAS2A (hereafter IRAS2A, see also Jennings et al. 1987; Looney et al. 2000) was observed with the IRAM-PdBI, at 218.5 GHz, using the WideX backends to cover the full 3.8 GHz spectral window at low spectral resolution. Higher resolution backends were placed onto a handful of molecular emission lines: two letters present the analysis of these data, used to explore the kinematics in the inner envelope (with methanol lines, Maret et al.) and the jet properties from molecular line emission (with SO and SiO lines, Codella et al.). A-array observations were obtained during two observing sessions, respectively in January and February 2011, while C-array observations were carried out in December 2010. The baselines sampled in our observations range from 19 m to 762 m, allowing us to recover emission on scales from ~8″ down to  . Calibration was carried out following standard procedures, using CLIC which is part of the GILDAS2 software. For both A tracks, phase was stable (rms < 50°) and pwv was 0.5–1 mm with system temperatures ~100–160 K, leading to less than 30% flagging in the dataset. For the C track, phase rms was <80°, pwv was 1–2 mm, and system temperatures were ~150–250 K, leading to less than 10% flagging in the resulting uv-table.
We merged the datasets to create the final visibility table for the spectra towards IRAS2A. The continuum was built by using the line-free channels, then continuum visibilities were subtracted from the dataset to create a pure spectral cube covering frequencies between 216.85 GHz and 220.45 GHz with a spectral resolution of 3.9 Mhz (~2.7 km s-1). Using natural weighting, the synthesized FWHM beam is ~ , with an rms noise of ~3 mJy/beam in the line-free channels of the spectra.
The line identification also used two additional CALYPSO PdBI datasets, consisting of wideband spectra around 231 GHz (setup S1) and 93 GHz (setup S3). These observations are not used in our analysis of the spatial distribution of the COM emission presented in Sect. 3 because their spatial resolution is lower than the spectra analyzed here (setup S2). These datasets will be described in a forthcoming paper that analyzes the chemistry in the IRAS2A envelope.
3. Line identification
We extracted the WideX spectrum at the continuum emission peak (αJ2000 = 03h28m55.575s, δJ2000 = 31°14′37.05″). The spectrum, presented in Fig. A.1, shows a wealth of emission lines whose properties are analyzed in the following. The method used to identify the detected lines is described in Appendix A. We report the first tentative detection of the vibrationally excited state ν5 = 1 of HNCO in a low-mass protostar (2 lines detected in setup S2, see Table 1). The small number of detected lines prevents us from claiming a firm detection, but these identifications are very plausible since the intensities of the lines are consistent with the model that fits the vibrational ground state emission of HNCO. Moreover, our data provides the first interferometric detection, in a Class 0 protostar, of deuterated methanol (CH2DOH: 4 lines detected in setup S2 and 14 lines detected in setups S1/S3 ), ethylene glycol (aGg′-(CH2OH)2: 5 lines detected in setup S2 and 11 lines detected in setups S1/S3), and a tentative detection for formamide (NH2CHO: 1 line in setup S1 and 1 line in setup S2).
4. Modeling of the visibilities
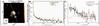 |
Fig. 1 a) CH3OCHO at 216.966 GHz (background image) and continuum around 219 GHz (contours) emission maps towards IRAS2A. The rms noise level is σ = 1.5 mJy/beam in the continuum, and σ = 2.8 mJy/beam in the CH3OCHO map (emission from one 2.7 km s-1 – channel). Contours are levels at 3σ, 5σ, 8σ and then from 10σ to 100σ in 10σ increment. The synthesized beam is |


The PdBI 1.4 mm dust continuum emission map is shown as contours in Fig. 1a. The present analysis only focuses on the emission associated with IRAS2A (MM1); the two secondary continuum sources seen at ![\hbox{$[1\farcs53 , -1\farcs49]$}](/articles/aa/full_html/2014/03/aa23033-13/aa23033-13-eq34.png) (MM2, 15 mJy/beam) and
(MM2, 15 mJy/beam) and ![\hbox{$[-0\farcs92 , -2\farcs21]$}](/articles/aa/full_html/2014/03/aa23033-13/aa23033-13-eq35.png) (MM3, 21 mJy/beam) were fitted as compact sources and removed from the continuum visibility table.
(MM3, 21 mJy/beam) were fitted as compact sources and removed from the continuum visibility table.
The resulting real part of the continuum visibility of the central source is plotted in Fig. 1b as a function of uv radius. The flux on baselines ~200 kλ is only half that predicted by interpolation of previous data on the same baselines at 90 GHz and 345 GHz (Looney et al. 2003; Jørgensen et al. 2005a); this difference could be due to secondary sources offset from the phase center, which were not removed (or not well resolved) in earlier studies and introduced a positive bias in the visibility amplitudes used by these authors. Figure 1b also reveals that the real part of the continuum visibility of the central IRAS2A source exhibits a smooth decline all the way out to our longest baseline of ≃550 kλ, with no sign of residual positive flux on resolved scales. We therefore performed a simple power-law fit to the continuum visibilities of the central source, shown in Fig. 1b. In the Rayleigh-Jeans approximation and for optically-thin dust emission, if the temperature and density in the envelope follow simple radial power laws ρ ∝ r− p and T ∝ r− q, the emergent dust continuum emission also has a simple power-law form I(r) ∝ r− (p + q − 1). For interferometric observations, the visibility distribution is V(b) ∝ b(p + q − 3), solely determined by the power-law indices of the temperature and density profiles in the envelope. We find that a power-law function V(b) ∝ b(− 0.45 ± 0.05), shown as a green line in Fig. 1b, reproduces well both the continuum emission visibility profile obtained from PdBI and the single-dish flux (0.85 Jy; Motte & André 2001). The continuum emission down to r ~ 35 AU can therefore be reproduced by a protostellar envelope model without the need for an additional large (200–300 AU diameter) disk component, previously suggested by Jørgensen et al. (2005a). The residuals map shown in Fig. 3a indeed shows that only the asymmetry on the eastern side of the envelope was not fitted properly by our power-law model. We note that our (p + q) value (~2.55) is in agreement with the protostellar envelope profile of IRAS2A on larger scales (p + q ~ 2.6) proposed from BIMA 2.7 mm observations (Looney et al. 2003).
Table 1 lists the spatial extent of the emission of each identified line that is detected with a medium or high signal-to-noise ratio towards IRAS2A. Owing to excitation and abundance variations, the line emission is unlikely to follow a power-law profile similar to the dust continuum emission. Therefore we modeled the visibilities with elliptical Gaussians and point sources to determine the emitting size of each of these molecular lines. We note that most of the lines are not spectrally resolved: the fit was performed on the emission in the channel showing the greatest flux to avoid possible contamination from neighboring lines; in most cases this is the channel at the systemic velocity of the core. An example of this modeling is shown in Fig. 1c. The best fit was kept when a chi-square minimization converged, complemented by a visual inspection of the residuals maps (see Fig. 3b for an example) to ensure that no significant emission was left around the IRAS2A source. The parameters of the best-fit model for each identified molecular line are given in Table 2. For the lines whose emission morphology is dominated by outflow- or jet-like structures (SiO and SO mainly), no satisfactory fit of their complex spatial distributions was found with elliptical Gaussian models, and values are not reported.
5. Discussion: origin of the COM emission
It is still being debated whether COM emission lines observed in low-mass Class 0 protostars are tracing embedded disks, shocks from protostellar jets, or the warm inner parts of protostellar envelopes. Bottinelli et al. (2004a) observed the Class 0 protostar IRAS 16293 (I16293 in the following) with the PdBI and found that the emission of CH3CN and CH3OCHO was unresolved on 180 AU scales, while observations of the NGC 1333-IRAS4A protostar showed that the CH3CN emission comes from a region ~175 AU (FWHM) in diameter (Bottinelli et al. 2008). These observations also showed that emission from CH3CN and CH3OCHO is not detected on large scales along the outflow axis but only on small scales around the embedded protostar. However, Jørgensen et al. (2007) used the Submillimeter Array (SMA) to observe the IRAS4A protostar and showed that CH3OH and H2CO emission is extended along the outflow axis; and SMA observations of I16293 detected a wealth of COM emission lines (Bisschop et al. 2008; Jørgensen et al. 2011), mostly unresolved. Pineda et al. (2012) and Zapata et al. (2013) used ALMA observations of I16293 to analyze the spatial and velocity distribution of 3 COM lines, and trace the infall on small scales around source B. Observations of IRAS2A with an angular resolution of ~2″ detected emission lines from five COMs, all spatially unresolved (Jørgensen et al. 2005a). Persson et al. (2012) and Kristensen et al. (2012) detected water emission in the IRAS2A envelope and outflow, both at the systemic and blue-shifted velocities.
Thanks to the bandwidth, sensitivity, and resolution of PdBI, emission from large samples of COMs can now be mapped in the very inner protostellar envelope: our analysis shows that tens of high excitation ( K) emission lines are detected and spatially resolved in our PdBI data. They probe various physical conditions (excitation temperatures range from ~30 K to 250 K for CH3OH and HNCO) and a wide range of upper-level energies, therefore allowing us to spatially resolve the hot corino emission in IRAS2A, for the first time. The emitting sizes of the molecules detected towards IRAS2A are shown in Fig. 2. All COMs are observed in the inner envelope at radii ≲100 AU. The best fit reproducing the dependency of emitting sizes with upper-level energies of the molecular transitions is a power law
 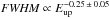 . However, the exact slope of this correlation is not very tightly constrained because of the limited number of high signal-to-noise lines, and a fit with a constant radius of 55 AU yields a only marginally higher χ2. The exact dependence of the emitting region radius with Eup will have to be explored with more COM lines detected with a higher signal-to-noise ratio. However, we note that the highest excitation lines that we spatially resolve are all located inside a region of radius r ~ 40 AU (average FWHM ~ 0.34″ for transitions with 300 K <Eup < 800 K).
Modeling the PdBI continuum data, we find that the dust continuum emission is well described by a protostellar envelope with a single power-law profile I(r) ∝ r-1.55 (see Sect. 3 and Fig. 1b), down to physical sizes (r ~ 35 AU) probed by our longest baselines. This suggests that, on scales where the COMs emit, the dust emission is still predominantly associated to the envelope and not to a protostellar disk. Since most COMs are released from dust grains, it suggests that the COMs are released in the warm inner envelope around the central protostellar object. Moreover, the observed size r ~ 40–100 AU for the COM emission in IRAS2A is in good agreement with predictions from simple analytical models computing the size of the hot corino region at T ≳ 100 K: if we assume a density profile ρ ∝ r-1.5 for the envelope, and with (p + q − 1) = 1.55 (see Sect. 3), the radius at which dust in the envelope reaches a temperature of 100 K is r100 K ~ 60 ± 5 AU ( 40 ± 3 AU with ρ ∝ r-2, see Eq. (2) in Motte & André 2001). We note, however, that the presence of an unresolved r < 40 AU disk in IRAS2A is not excluded by our observations, and could contribute to the emission of COMs on the smaller, unresolved scales.
The emission of the least complex molecules (e.g., H2CO, DCN, OCS) tends to be elongated along position angles ≲30° of the protostellar jet PA – traced by SiO emission (see Codella et al. 2014). This emission cannot be due to sputtering in shocks since the observed velocities are very close to the systemic velocity of the core. Therefore, these emission lines are most probably due to thermal or photodesorption in the UV-heated cavity walls (Visser et al. 2012): this might illustrate the contribution of the irradiated outflow walls, e.g., the warm envelope material with non-spherical geometry at Tdust > 100 K, to the hot corino emission. However, we stress that the spatial distribution of the COM emission at high Eup does not show a preferential elongation along the outflow/jet axis: the median aspect ratio of the best-fit elliptical Gaussian models is ~1.7, but the position angles are very widely distributed from − 80° to 85° (see Table 2).
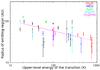 |
Fig. 2 Emission size (average radius of the best-fit elliptical Gaussian) of the molecular lines listed in Table 2 as a function of their upper-level energy. Only the spatially resolved, unblended lines for which a good fit could be achieved are represented. Black symbols show the molecules for which only one emission line is observed and/or resolved in setup S2, while colored symbols show molecules for which several lines are detected and resolved. The error bars are the largest error bar (minor or major axis) produced by the fit with an elliptical Gaussian model. The pink line shows the best power-law fit to the data, as described in the text. All COM lines that are resolved emit in a region of radius ≲100 AU. |
The spectral resolution of the WideX data prevents us from carrying out any kinematic study of those lines. However, these COM emission lines are detected at velocities close to the systemic velocity of the protostar (±1.4 km s-1, see Table 2). Therefore it is very unlikely that these molecules are formed from non-thermal desorption mechanisms due to the interaction of a collimated high-velocity jet with the surrounding envelope material, as suggested by Öberg et al. (2011). Instead the kinematical and spatial distribution information from our data draw a picture where the COM emission originates from warm material surrounding the protostar and dynamically associated to the protostellar envelope: the so-called hot corino region. This opens up the perspective of using complex molecules as tracers of the inner envelope kinematics, down to the ≲100 AU sizes where rotationally-supported protostellar disks may form, and accretion proceeds on the protostar itself. In a related paper, we make use of the high spectral resolution observations of two methanol emission lines to assess their kinematical properties (Maret et al. 2014).
To conclude, our results strongly support a scenario where the COM emission in IRAS2A originates from a hot corino, i.e., the release of complex molecules in the gas phase of the inner (≲100 AU) envelope, when a critical temperature allowing sublimation of icy grain mantles is reached, and not from shocks at the base of the jet. Analysis of the CALYPSO observations toward the remaining 16 Class 0 objects in our sample will enhance the statistics on the occurrence of COM emission in Class 0 protostars, and determine if they always trace a hot corino in the warm inner envelope of these objects. If this is the case, the analysis of spectral emission lines from complex molecules will be a powerful tool for tracing the protostellar kinematics during the disk formation epoch, on scales where protoplanetary disks are observed at later (e.g., T-Tauri) stages.
Online material
List of emission lines detected at the peak of the dust continuum emission at 219 GHz towards IRAS2A.
Properties of identified emission lines detected toward the continuum peak emission of IRAS2A around 219 GHz.
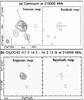 |
Fig. 3 Emission and residual maps of the continuum emission and CH3OCHO line emission at 217 GHz. a) The left and right panels, respectively, show the PdBI continuum emission map and residuals map. The residuals map was obtained by removing the two secondary sources as point sources, then removing the best-fit power-law model visibilities from the data visibilities, and imaging the residuals table. Contours show the levels of 3σ, 5σ, and 8σ, and then 10σ to 100σ in 10σ steps. The cross shows the phase center of our observations, coinciding with the peak of the continuum emission at 1.4 mm. b) The left and right panels, respectively, show the CH3OCHO emission and residual maps. In the maps, the rms noise level is σ = 2.8 mJy/beam. Contours show the 3σ, 5σ, and 8σ, and then 10σ to 60σ in 10σ steps. |
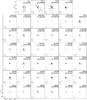 |
Fig. 4 Emission maps for most of the identified molecular emission lines in the spectrum of IRAS2A. While CO isotopologues and H2CO (upper set of panels) are tracing the large-scale envelope and outflow structures, complex molecules (rows 2 to 7) are tracing a compact but often spatially-resolved emission centered on the maximum of the continuum emission. Some molecular lines are blended, see Table 1 for further information. Contours show the 3σ, 5σ, and 8σ, and then 10σ to 100σ in 20σ steps. |
Appendix A: Line identification
We extracted the WideX spectrum at the continuum emission peak (αJ2000 = 03h28m55.575s, δJ2000 = 31°14′37.05″) shown in Fig. A.1. The line identification was performed with the XCLASS software3 under the assumption of local thermodynamic equilibrium. Our spectroscopic database contains all entries of the CDMS (Müller et al. 2005) and JPL (Pickett et al. 1998) catalogs, as well as a few private entries (for more details, see Belloche et al. 2013). The spectra were modeled species by species. For most species, an excitation temperature of 100 K was assumed for the LTE modeling, while for a few species the detection of several transitions with significantly different upper-level energies allowed us to leave the temperature as a free
parameter of our modeling (finding temperatures up to ~250 K for CH3OH and HNCO, for example). For each species, the spectra in all three frequency setups were modeled at once, using five parameters: source size, temperature, column density, line width, and velocity offset with respect to the systemic velocity of the source. The emission of all transitions was assumed to come from a source of size  (average FWHM, see Sect. 3). The fit optimization was performed by eye. For a few species (SO, SiO, CO), it was necessary to include several velocity components to account for the shape of the detected lines. A total of 86 emission lines with peak signal-to-noise ratios higher than 3 were detected at the position of the continuum emission peak, in setup S2, among which 55 are identified, see Table 1.
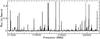 |
Fig. A.1 Continuum-subtracted WideX spectrum around 218.5 GHz (setup S2), at the position of the maximum of 1.4 mm continuum emission towards IRAS2A (shown in Fig.1a). |
Acknowledgments
We thank Holger Müller for the spectroscopic predictions of HNCO, ν5 = 1. We are very thankful to the IRAM staff, whose dedication allowed us to carry out the CALYPSO project. This research has received funding from the European Community’s Seventh Framework Programme (/FP7/2007-2013/) under grant agreements No. 229517 (ESO COFUND) and No. 291294 (ORISTARS). S.M. acknowledges the support of the French Agence Nationale de la Recherche (ANR), under reference ANR-12-JS05-0005.
References
- André, P., Ward-Thompson, D., & Barsony, M. 2000, Protostars and Planets IV, 59 [Google Scholar]
- Bachiller, R., & Perez Gutierrez, M. 1997, ApJ, 487, L93 [NASA ADS] [CrossRef] [Google Scholar]
- Belloche, A., Müller, H. S. P., Menten, K. M., Schilke, P., & Comito, C. 2013, A&A, 559, A47 [NASA ADS] [CrossRef] [EDP Sciences] [Google Scholar]
- Bisschop, S. E., Jørgensen, J. K., Bourke, T. L., Bottinelli, S., & van Dishoeck, E. F. 2008, A&A, 488, 959 [NASA ADS] [CrossRef] [EDP Sciences] [Google Scholar]
- Bottinelli, S., Ceccarelli, C., Lefloch, B., et al. 2004a, ApJ, 615, 354 [NASA ADS] [CrossRef] [Google Scholar]
- Bottinelli, S., Ceccarelli, C., Neri, R., et al. 2004b, ApJ, 617, L69 [NASA ADS] [CrossRef] [Google Scholar]
- Bottinelli, S., Ceccarelli, C., Williams, J. P., & Lefloch, B. 2007, A&A, 463, 601 [NASA ADS] [CrossRef] [EDP Sciences] [Google Scholar]
- Bottinelli, S., Ceccarelli, C., Neri, R., & Williams, J. P. 2008, in IAU Symp. 251, eds. S. Kwok, & S. Sanford, 117 [Google Scholar]
- Cazaux, S., Tielens, A. G. G. M., Ceccarelli, C., et al. 2003, ApJ, 593, L51 [NASA ADS] [CrossRef] [Google Scholar]
- Ceccarelli, C. 2004, in Star Formation in the Interstellar Medium: In Honor of David Hollenbach, eds. D. Johnstone, F. C. Adams, D. N. C. Lin, D. A. Neufeeld, & E. C. Ostriker, ASP Conf. Ser., 323, 195 [Google Scholar]
- Ceccarelli, C. 2007, in Molecules in Space and Laboratory (S. Diana) [Google Scholar]
- Chandler, C. J., Brogan, C. L., Shirley, Y. L., & Loinard, L. 2005, ApJ, 632, 371 [NASA ADS] [CrossRef] [Google Scholar]
- Codella, C., Maury, A., Gueth, F., et al. 2014, A&A, 563, L3 (Paper III) [NASA ADS] [CrossRef] [EDP Sciences] [Google Scholar]
- Garrod, R. T., Weaver, S. L. W., & Herbst, E. 2008, ApJ, 682, 283 [NASA ADS] [CrossRef] [Google Scholar]
- Hirota, T., Bushimata, T., Choi, Y. K., et al. 2008, PASJ, 60, 37 [NASA ADS] [CrossRef] [Google Scholar]
- Jennings, R. E., Cameron, D. H. M., Cudlip, W., & Hirst, C. J. 1987, MNRAS, 226, 461 [NASA ADS] [CrossRef] [Google Scholar]
- Jørgensen, J. K., Bourke, T. L., Myers, P. C., et al. 2005a, ApJ, 632, 973 [NASA ADS] [CrossRef] [Google Scholar]
- Jørgensen, J. K., Schöier, F. L., & van Dishoeck, E. F. 2005b, A&A, 437, 501 [NASA ADS] [CrossRef] [EDP Sciences] [Google Scholar]
- Jørgensen, J. K., Bourke, T. L., Myers, P. C., et al. 2007, ApJ, 659, 479 [NASA ADS] [CrossRef] [Google Scholar]
- Jørgensen, J. K., Bourke, T. L., Nguyen Luong, Q., & Takakuwa, S. 2011, A&A, 534, A100 [NASA ADS] [CrossRef] [EDP Sciences] [Google Scholar]
- Kristensen, L. E., van Dishoeck, E. F., Bergin, E. A., et al. 2012, A&A, 542, A8 [NASA ADS] [CrossRef] [EDP Sciences] [Google Scholar]
- Looney, L., Mundy, L., & Welch, W. 2000, ApJ, 529, 477 [NASA ADS] [CrossRef] [Google Scholar]
- Looney, L., Mundy, L., & Welch, W. 2003, ApJ, 592, 255 [NASA ADS] [CrossRef] [Google Scholar]
- Maret, S., Belloche, A., Maury, A., et al. 2014, A&A, 563, L1 (Paper I) [NASA ADS] [CrossRef] [EDP Sciences] [Google Scholar]
- Motte, F., & André, P. 2001, A&A, 365, 440 [NASA ADS] [CrossRef] [EDP Sciences] [Google Scholar]
- Müller, H. S. P., Schlöder, F., Stutzki, J., & Winnewisser, G. 2005, J. Mol. Struct., 742, 215 [NASA ADS] [CrossRef] [Google Scholar]
- Öberg, K. I., van der Marel, N., Kristensen, L. E., & van Dishoeck, E. F. 2011, ApJ, 740, 14 [NASA ADS] [CrossRef] [Google Scholar]
- Persson, M. V., Jørgensen, J. K., & van Dishoeck, E. F. 2012, A&A, 541, A39 [NASA ADS] [CrossRef] [EDP Sciences] [Google Scholar]
- Pickett, H. M., Poynter, R. L., Cohen, E. A., et al. 1998, J. Quant. Spectr. Radiat. Transf., 60, 883 [Google Scholar]
- Pineda, J. E., Maury, A. J., Fuller, G. A., et al. 2012, A&A, 544, L7 [NASA ADS] [CrossRef] [EDP Sciences] [Google Scholar]
- van Dishoeck, E., & Blake, G. 1998, ARA&A, 36, 317 [NASA ADS] [CrossRef] [Google Scholar]
- Visser, R., Kristensen, L. E., Bruderer, S., et al. 2012, A&A, 537, A55 [NASA ADS] [CrossRef] [EDP Sciences] [Google Scholar]
- Zapata, L. A., Loinard, L., Rodríguez, L. F., et al. 2013, ApJ, 764, L14 [NASA ADS] [CrossRef] [Google Scholar]
All Tables
List of emission lines detected at the peak of the dust continuum emission at 219 GHz towards IRAS2A.
Properties of identified emission lines detected toward the continuum peak emission of IRAS2A around 219 GHz.
All Figures
|
Fig. 1 a) CH3OCHO at 216.966 GHz (background image) and continuum around 219 GHz (contours) emission maps towards IRAS2A. The rms noise level is σ = 1.5 mJy/beam in the continuum, and σ = 2.8 mJy/beam in the CH3OCHO map (emission from one 2.7 km s-1 – channel). Contours are levels at 3σ, 5σ, 8σ and then from 10σ to 100σ in 10σ increment. The synthesized beam is |
| In the text | |
|
Fig. 2 Emission size (average radius of the best-fit elliptical Gaussian) of the molecular lines listed in Table 2 as a function of their upper-level energy. Only the spatially resolved, unblended lines for which a good fit could be achieved are represented. Black symbols show the molecules for which only one emission line is observed and/or resolved in setup S2, while colored symbols show molecules for which several lines are detected and resolved. The error bars are the largest error bar (minor or major axis) produced by the fit with an elliptical Gaussian model. The pink line shows the best power-law fit to the data, as described in the text. All COM lines that are resolved emit in a region of radius ≲100 AU. |
| In the text | |
|
Fig. 3 Emission and residual maps of the continuum emission and CH3OCHO line emission at 217 GHz. a) The left and right panels, respectively, show the PdBI continuum emission map and residuals map. The residuals map was obtained by removing the two secondary sources as point sources, then removing the best-fit power-law model visibilities from the data visibilities, and imaging the residuals table. Contours show the levels of 3σ, 5σ, and 8σ, and then 10σ to 100σ in 10σ steps. The cross shows the phase center of our observations, coinciding with the peak of the continuum emission at 1.4 mm. b) The left and right panels, respectively, show the CH3OCHO emission and residual maps. In the maps, the rms noise level is σ = 2.8 mJy/beam. Contours show the 3σ, 5σ, and 8σ, and then 10σ to 60σ in 10σ steps. |
| In the text | |
|
Fig. 4 Emission maps for most of the identified molecular emission lines in the spectrum of IRAS2A. While CO isotopologues and H2CO (upper set of panels) are tracing the large-scale envelope and outflow structures, complex molecules (rows 2 to 7) are tracing a compact but often spatially-resolved emission centered on the maximum of the continuum emission. Some molecular lines are blended, see Table 1 for further information. Contours show the 3σ, 5σ, and 8σ, and then 10σ to 100σ in 20σ steps. |
| In the text | |
|
Fig. A.1 Continuum-subtracted WideX spectrum around 218.5 GHz (setup S2), at the position of the maximum of 1.4 mm continuum emission towards IRAS2A (shown in Fig.1a). |
| In the text | |
Current usage metrics show cumulative count of Article Views (full-text article views including HTML views, PDF and ePub downloads, according to the available data) and Abstracts Views on Vision4Press platform.
Data correspond to usage on the plateform after 2015. The current usage metrics is available 48-96 hours after online publication and is updated daily on week days.
Initial download of the metrics may take a while.