Fig. 4
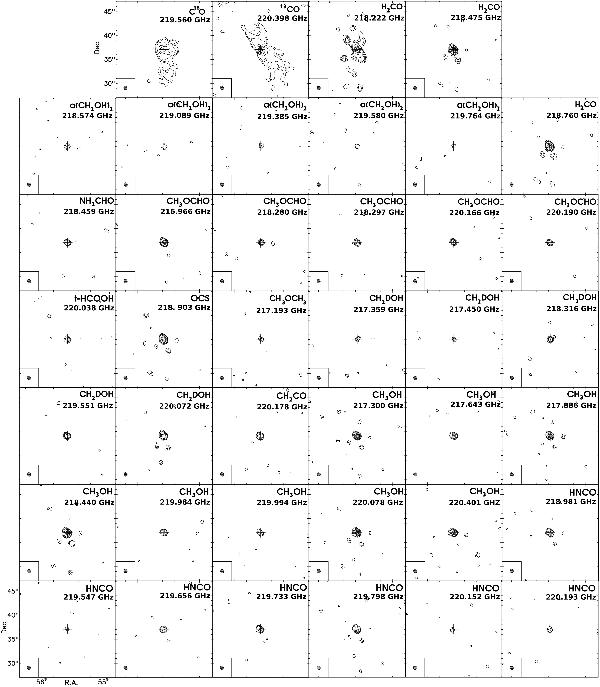
Emission maps for most of the identified molecular emission lines in the spectrum of IRAS2A. While CO isotopologues and H2CO (upper set of panels) are tracing the large-scale envelope and outflow structures, complex molecules (rows 2 to 7) are tracing a compact but often spatially-resolved emission centered on the maximum of the continuum emission. Some molecular lines are blended, see Table 1 for further information. Contours show the 3σ, 5σ, and 8σ, and then 10σ to 100σ in 20σ steps.
Current usage metrics show cumulative count of Article Views (full-text article views including HTML views, PDF and ePub downloads, according to the available data) and Abstracts Views on Vision4Press platform.
Data correspond to usage on the plateform after 2015. The current usage metrics is available 48-96 hours after online publication and is updated daily on week days.
Initial download of the metrics may take a while.