Fig. 2
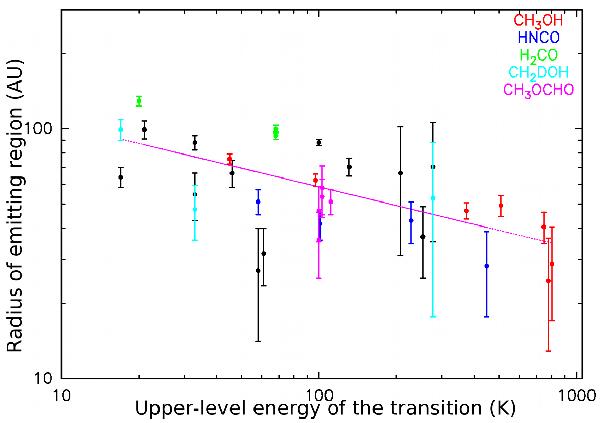
Emission size (average radius of the best-fit elliptical Gaussian) of the molecular lines listed in Table 2 as a function of their upper-level energy. Only the spatially resolved, unblended lines for which a good fit could be achieved are represented. Black symbols show the molecules for which only one emission line is observed and/or resolved in setup S2, while colored symbols show molecules for which several lines are detected and resolved. The error bars are the largest error bar (minor or major axis) produced by the fit with an elliptical Gaussian model. The pink line shows the best power-law fit to the data, as described in the text. All COM lines that are resolved emit in a region of radius ≲100 AU.
Current usage metrics show cumulative count of Article Views (full-text article views including HTML views, PDF and ePub downloads, according to the available data) and Abstracts Views on Vision4Press platform.
Data correspond to usage on the plateform after 2015. The current usage metrics is available 48-96 hours after online publication and is updated daily on week days.
Initial download of the metrics may take a while.