Fig. 3
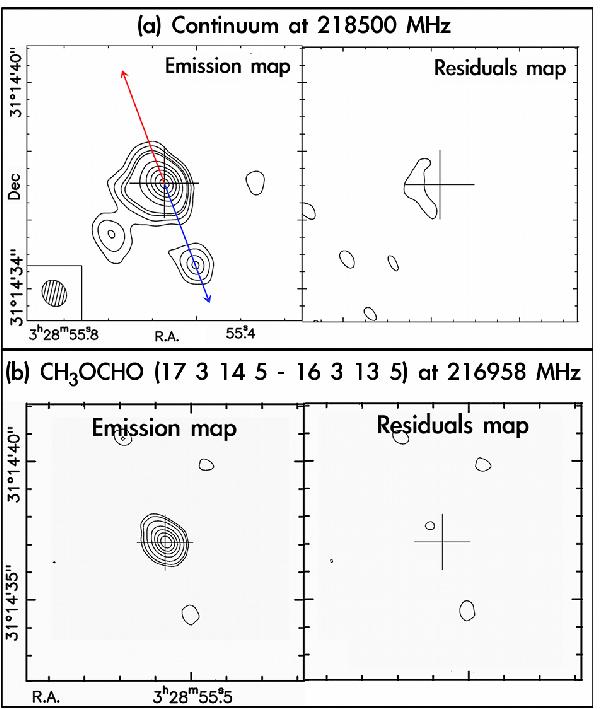
Emission and residual maps of the continuum emission and CH3OCHO line emission at 217 GHz. a) The left and right panels, respectively, show the PdBI continuum emission map and residuals map. The residuals map was obtained by removing the two secondary sources as point sources, then removing the best-fit power-law model visibilities from the data visibilities, and imaging the residuals table. Contours show the levels of 3σ, 5σ, and 8σ, and then 10σ to 100σ in 10σ steps. The cross shows the phase center of our observations, coinciding with the peak of the continuum emission at 1.4 mm. b) The left and right panels, respectively, show the CH3OCHO emission and residual maps. In the maps, the rms noise level is σ = 2.8 mJy/beam. Contours show the 3σ, 5σ, and 8σ, and then 10σ to 60σ in 10σ steps.
Current usage metrics show cumulative count of Article Views (full-text article views including HTML views, PDF and ePub downloads, according to the available data) and Abstracts Views on Vision4Press platform.
Data correspond to usage on the plateform after 2015. The current usage metrics is available 48-96 hours after online publication and is updated daily on week days.
Initial download of the metrics may take a while.