Fig. 1
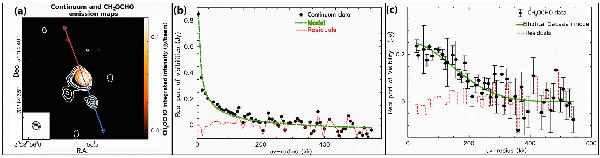
a) CH3OCHO at 216.966 GHz (background image) and continuum around 219 GHz (contours) emission maps towards IRAS2A. The rms noise level is σ = 1.5 mJy/beam in the continuum, and σ = 2.8 mJy/beam in the CH3OCHO map (emission from one 2.7 km s-1 – channel). Contours are levels at 3σ, 5σ, 8σ and then from 10σ to 100σ in 10σ increment. The synthesized beam is  (PA 32°). The red and blue arrows show the direction of the main bipolar jet axis (Jørgensen et al. 2007). b) Continuum (real part of the visibilities, black points) and corresponding best-fit power-law model (green dashed line) averaged over baseline bins of 10 m, as a function of baseline length. Residuals are shown as a red line. The zero-spacing flux is extrapolated from the single-dish flux at 850 μm by Motte & André (2001). c) Real part of the visibilities (black points) from the CH3OCHO (20 0 20 2–19 1 19 1) emission line and corresponding best-fit Gaussian model (FWHM
  ×
× , PA 41°, green line). Residuals are shown as a red line.
Current usage metrics show cumulative count of Article Views (full-text article views including HTML views, PDF and ePub downloads, according to the available data) and Abstracts Views on Vision4Press platform.
Data correspond to usage on the plateform after 2015. The current usage metrics is available 48-96 hours after online publication and is updated daily on week days.
Initial download of the metrics may take a while.