| Issue |
A&A
Volume 562, February 2014
|
|
|---|---|---|
| Article Number | A2 | |
| Number of page(s) | 22 | |
| Section | Catalogs and data | |
| DOI | https://doi.org/10.1051/0004-6361/201322516 | |
| Published online | 29 January 2014 | |
The 100-month Swift catalogue of supergiant fast X-ray transients⋆
I. BAT on-board and transient monitor flares⋆⋆
1 INAF, Istituto di Astrofisica Spaziale e Fisica Cosmica – Palermo, via U. La Malfa 153, 90146 Palermo, Italy
This email address is being protected from spambots. You need JavaScript enabled to view it.
2 NASA/Goddard Space Flight Center, Greenbelt MD 20771, USA
3 Universities Space Research Association, Columbia, MD, USA
4 Los Alamos National Laboratory, B244, Los Alamos NM 87545, USA
5 Institut für Astronomie und Astrophysik, Eberhard Karls Universität, Sand 1, 72076 Tübingen, Germany
6 INAF, Istituto di Astrofisica Spaziale e Fisica Cosmica – Milano, Via E. Bassini 15, 20133 Milano, Italy
7 University of Leicester, X-ray and Observational Astronomy Group, Department of Physics & Astronomy, University Road, Leicester LE1 7RH, UK
8 Department of Physics and Earth Sciences, University of Ferrara, Via Saragat 1, 44122 Ferrara, Italy
9 Department of Astronomy and Astrophysics, Pennsylvania State University, University Park PA 16802, USA
Received: 21 August 2013
Accepted: 27 November 2013
Abstract
Context. Supergiant fast X-ray transients (SFXTs) are high mass X-ray binaries (HMXBs) that are defined by their hard X-ray flaring behaviour. During these flares they reach peak luminosities of 1036–1037 erg s-1 for a few hours (in the hard X-ray), which are much shorter timescales than those characterizing Be/X-ray binaries.
Aims. We investigate the characteristics of bright flares (detections in excess of 5σ) for a sample of SFXTs and their relation to the orbital phase.
Methods. We have retrieved all Swift/BAT Transient Monitor light curves and collected all detections in excess of 5σ from both daily- and orbital-averaged light curves in the time range of 2005 February 12 to 2013 May 31 (MJD 53 413–56 443). We also considered all on-board detections as recorded in the same time span and selected those in excess of 5σ and within 4 arcmin of each source in our sample.
Results. We present a catalogue of over a thousand BAT flares from 11 SFXTs, down to 15–150 keV fluxes of ~6 × 10⁻¹⁰ erg cm-2 s-1 (daily timescale) and ~1.5 × 10⁻⁹ erg cm-2 s-1 (orbital timescale, averaging ~800 s); the great majority of these flares are unpublished. The catalogue spans 100 months. This population is characterized by short (a few hundred seconds) and relatively bright (in excess of 100 mCrab, 15–50 keV) events. In the hard X-ray, these flares last generally much less than a day. Clustering of hard X-ray flares can be used to indirectly measure the length of an outburst, even when the low-level emission is not detected. We construct the distributions of flares, of their significance (in terms of σ), and of their flux as a function of orbital phase to infer the properties of these binary systems. In particular, we observe a trend of clustering of flares at some phases as Porb increases, which is consistent with a progression from tight circular or mildly eccentric orbits at short periods to wider and more eccentric orbits at longer orbital periods. Finally, we estimate the expected number of flares for a given source for our limiting flux and provide the recipe for calculating them for the limiting flux of future hard X-ray observatories.
Key words: X-rays: binaries / catalogs / binaries: close / stars: neutron
Project web page: http://www.ifc.inaf.it/sfxt/
Full Table 4 is only available at the CDS via anonymous ftp to cdsarc.u-strasbg.fr (130.79.128.5) or via http://cdsarc.u-strasbg.fr/viz-bin/qcat?J/A+A/562/A2
© ESO, 2014
1. Introduction
Supergiant fast X-ray transients (SFXTs) are a class of high mass X-ray binaries (HMXBs) associated with OB supergiant stars brought to the foreground by INTEGRAL (Smith et al. 2004; Sguera et al. 2005; Negueruela et al. 2006b). They display sporadic X-ray outbursts characterized by bright flares with peak luminosities of 1036–1037 erg s-1 that last for a few hours (as observed by INTEGRAL; Sguera et al. 2005; Negueruela et al. 2006a), which are significantly shorter than those of typical Be/X-ray binaries. In quiescence (e.g. in’t Zand 2005; Bozzo et al. 2010), they have a luminosity of ~ 1032 erg s-1; therefore, one defining characteristic of SFXTs is the dynamic range of 3–5 orders of magnitude. During outburst their hard X-ray spectra resemble those of HMXBs that host accreting neutron stars (NS), with hard power laws below 10 keV, which are combined with high energy cut-offs at ~ 15–30 keV and sometimes strongly absorbed at soft energies (Walter et al. 2006). Therefore, it is tempting to assume that all SFXTs might host a neutron star, even if pulse periods have only been measured for just a few of them. The mechanism producing the outbursts is still subject to debate but it is probably related to either the properties of the wind from the supergiant companion (in’t Zand 2005; Walter & Zurita Heras 2007; Negueruela et al. 2008; Sidoli et al. 2007) or the presence of gated mechanisms (Grebenev & Sunyaev 2007; Bozzo et al. 2008b). Given the typical timescales of SFXT activity, it is convenient to distinguish between a flare, which is a state of enhanced emission generally lasting for a few hours, and an outburst, which is composed of several flares and lasts for about a day or more (e.g. Romano et al. 2007b; Rampy et al. 2009).
Swift (Gehrels et al. 2004) has been shedding new light on the phenomenon of SFXTs, thanks to its unique properties of automatic fast-slewing and broad-band energy coverage, that make it the only observatory which can detect outbursts from SFXTs from the very beginning and observe their evolution panchromatically. Indeed, the bright flares from SFXTs have been triggering the Burst Alert Telescope (BAT, Barthelmy et al. 2005) since early after launch. However, while the most spectacular evidence of SFXT activity comes from their outbursts, SFXTs are characterized by flares in all intensity states (e.g. Bozzo et al. 2010; Bodaghee et al. 2011). Several ks-long bright flares were, for instance, observed with the X-ray Telescope (XRT, Burrows et al. 2005) during the monitoring campaigns that were performed by taking advantage of Swift’s scheduling flexibility, on 4 SFXTs during 2007–2009 (Sidoli et al. 2008a; Romano et al. 2009e, 2011a).
As the BAT observes 88% of the sky daily, on average, it is ideally suited to detect flaring in hard X-ray astrophysical sources. Since 2005 February 12, the BAT Transient Monitor1 (Krimm et al. 2013) has been providing near real-time light curves in the 15–50 keV energy range of more than 900 sources with a mean variance for one-day mosaics of 5.3 mCrab. Several flares from SFXTs are regularly caught every year by the BAT Transient Monitor.
Finally, BAT maintains a per-source flux threshold in its on-board catalogue. A source detection does not result in a Gamma-ray Coordinates Network (GCN)2 Notice and possible follow-up observations unless it exceeds its threshold. When BAT responds to a source, it automatically raises the threshold so that repeated bursts only cause a further response if they are significantly larger than earlier ones. The source threshold can be manually lowered to re-enable automatic observations on its next burst and such is the case for SFXTs.
In this paper, we present for the first time the catalogue of all flares, the great majority of which are unpublished, registered by the BAT both on board and on the ground by the Transient Monitor between 2005 February 12 and 2013 May 31. The SFXT sample is defined in Sect. 2 along with a review of the most relevant literature. The methods for reduction and analysis and our results are presented in Sect. 3. In a companion paper (Romano, in prep.), we present an in depth, broadband analysis of all the outbursts that triggered the BAT during the same time span.
Sample of confirmed SFXTs: Positions and optical counterparts.
Sample of SFXTs: spin, orbital and superorbital periods, and proposed eccentricities.
2. The SFXT sample
Defining a complete sample of SFXTs has been a challenge, due to the initially loose constraints often applied to the defining characteristics of their X-ray emission and the intrinsic difficulty in performing optical spectroscopy on the often heavily absorbed companion stars. In this work, we distinguish between confirmed and SFXT candidates based on the availability of an optical classification of the companion: a confirmed SFXT is a transient that has shown a repeated, high-dynamical range, flaring activity that is firmly associated with an OB supergiant, while an SFXT candidate has shown similar X-ray behaviour but has no confirmed association with an OB supergiant companion.
The sources in our sample of SFXTs were selected from the literature based on evidence of bright flares (peak L ≳ 1036 erg s-1), as recorded by ASCA, RXTE, INTEGRAL, and Swift. The full list of all confirmed SFXTs that triggered the BAT is reported in Table 1 along with the currently most accurate X-ray positions, their errors (Cols. 2–4), the optical counterpart, its spectral type, distance (Cols. 5–7), the reference to discovery, positions, and counterpart properties (Cols. 8–11). Table 2 reports the spin and orbital periods, eccentricities, super-orbital periods and the presence of eclipses in the X-ray light curve.
In the following, we summarize the basic information on each source in the SFXT class we considered for this work with a special emphasis on those that triggered the BAT (in any of the ways described above).
2.1. IGR J08408−4503
The transient IGR J08408−4503 was discovered on 2006 May 15 during a 900 s bright flare that reached a peak flux of 250 mCrab (20–40 keV, Götz et al. 2006). Mereghetti et al. (2006) later demonstrated its recurrent transient nature by discovering an earlier active state in 2003. It is associated with the O8.5Ib(f) supergiant star, HD 74194, in the Vela region (Masetti et al. 2006a) at a distance of ~3 kpc (Leyder et al. 2007). No information is available on the orbital or spin periods.
IGR J08408−4503 triggered the BAT several times with its most remarkable outburst on 2008 July 5 (Romano et al. 2009d), during which the XRT light curve showed a multiple-peaked structure with a first bright flare that reached ~10-9 erg cm-2 s-1 (2–10 keV), which were followed by two equally bright flares within 75 ks. The spectral characteristics of these flares differ dramatically, with most of the difference being due to absorbing column variations. A gradual decrease of the NH was also observed and interpreted as due to an ionization effect produced by the first flare, which resulted in a significant decrease in the measured column density towards the source.
Recent papers report the properties of the quiescent state of IGR J08408−4503. Bozzo et al. (2010), in particular, show that the flaring behaviour extends down to 3 × 10-13 erg cm-2 s-1 (0.5–10 keV, or a luminosity of 3.3 × 1032 erg s-1), thus confirming a dynamical range in excess of 104.
2.2. IGR J11215−5952
The object IGR J11215−5952 was discovered on 2005 April 22 when it reached ~75 mCrab (20–60 keV). It was associated with HD 306414 (Negueruela et al. 2005a), a B1Ia supergiant (Vijapurkar & Drilling 1993) located at a distance of 6.2 kpc (Masetti et al. 2006b). The source is a pulsar with spin period Pspin = 186.78 ± 0.3 s (Swank et al. 2007). The orbital period, which was initially supposed to be ~330 d (Sidoli et al. 2006), was later pinpointed, by means of Swift (Romano et al. 2007a; Sidoli et al. 2007, 2008b; Romano et al. 2009f), to Porb = 164.6 d, the longest measured for an SFXT.
This source has been the focal point of several Swift/XRT observing campaigns, starting from the observations of the 2007 February 9 outburst (Romano et al. 2007b), through which we discovered that the X-ray emission, hence the accretion phase, lasts much longer than previously observed using less sensitive instruments. The timescale is not on the order of minutes or hours, but several days. In particular, in Sidoli et al. (2007) an explanation was proposed for the SFXTs outburst based on the periodic nature of the outbursts of this source and on the narrow shape of its X-ray light curve as observed with XRT. The periodicity in the outbursts suggests it is being driven by the orbital period, with outbursts triggered at, or near, the periastron passage. The shape of the observed light curve, on the other hand, can only be explained with accretion from non spherically-symmetric winds. Therefore, the suggestion was made of the presence of a second component of the clumpy wind, such as an equatorially-enhanced wind component (or any other preferential plane for the outflowing wind), which is denser and slower than the symmetric polar wind from the blue supergiant, and inclined with respect to the orbital plane of the system. This object has also recently been added to the new class of Galactic transient MeV/TeV emitters, as a counterpart candidate of EGR J1122−5946 (Sguera 2008).
We note that IGR J11215−5952 never triggered the BAT, so it is only included in this Section for the sake of completeness and will not be discussed further.
2.3. IGR J16328−4726
The source IGR J16328−4726 (Bird et al. 2007) has a history of hard X-ray activity characterized by short flares lasting up to a few hours (Fiocchi et al. 2010). It triggered the Swift/BAT on 2009 June 10 (Romano et al. 2013), when the source reached an unabsorbed 2–10 keV flux of ~4 × 10⁻¹⁰ erg cm-2 s-1. The Swift arcsecond position allowed Grupe et al. (2009) to propose the IR star 2MASS J16323791−4723409 as the optical counterpart which is classified as an O8Iafpe supergiant star by Coleiro et al. (2013). The orbital period is Porb = 10.076 ± 0.003 d (Corbet et al. 2010).
Recently, Bozzo et al. (2012) reported luminosity variations by a factor of 10 during a 22 ks XMM-Newton observation performed on 2011 February 20, when the source was in a much fainter flux state (unabsorbed F2 − 10 keV = 1.7 × 10⁻¹¹ erg cm-2 s-1) than the one observed during the BAT outburst.
2.4. IGRJ 16418−4532
The transient IGR J16418−4532 was discovered on 2003 February 1–5 (Tomsick et al. 2004) during an INTEGRAL scan of the Norma Region when it reached a flux of 3 × 10-11 erg cm-2 s-1 (20–40 keV). Subsequent flares were reported by Sguera et al. (2006) on 2004 February 26, during which fast (~1 h) X-ray outbursts were observed peaking at ~ 80 mCrab (20–30 keV). Ducci et al. (2010) detected 23 more outbursts and calculated an activity duty cycle of ~ 1% (one of the highest among the 14 SFXTs and SFXT candidates they examined) and fluxes ranging between 1.3 × 10⁻¹⁰ erg cm-2 s-1 and 4.8 × 10⁻¹⁰ erg cm-2 s-1 (18–100 keV). Based on the XMM-Newton position, Chaty et al. (2008) proposed 2MASS J16415078−4532253 as the best near infrared (NIR) counterpart candidate, which is classified as BN0.5Ia by Coleiro et al. (2013).
Walter et al. (2006) discovered a pulsation at 1246 ± 100 s. Corbet et al. (2006) discovered an orbital period of ~3.75 d, as based on RXTE/ASM data, and an eclipse. Recently, a super-orbital modulation has been detected in the Swift/BAT light curve (Corbet & Krimm 2013b) at Psup = 14.730 ± 0.006 d.
This source was intensively observed with Swift/XRT along the orbital period between 2011 July 13–30 (Romano et al. 2012b). As observed in IGR J18483−0311, the light curve shows an orbital modulation and flaring episodes. By assuming a circular orbit, Romano et al. (2012b) could explain their X-ray emission in terms of the accretion from a spherically symmetric clumpy wind, which is composed of clumps with masses ranging from ~5 × 10¹⁶ g to 1021 g.
2.5. IGR J16465−4507
The source IGR J16465−4507 was discovered by INTEGRAL on 2004 September 6–7 (Lutovinov et al. 2004), when it averaged 8.8 ± 0.9 mCrab (18–60 keV) and subsequently showed a strong flare at ~28 mCrab on September 7. The optical counterpart 2MASS J16463526−4507045 (Zurita Heras & Walter 2004) was classified as a B0.5I star by Negueruela et al. (2005b, USNO-B1.0 0448− and later refined to B0.5Ib (Negueruela et al. 2007) at a distance of about 8 kpc (but also see Nespoli et al. 2008; Rahoui et al. 2008).
It is a pulsar with Pspin = 228 ± 6 s (Lutovinov et al. 2005) and orbital period Porb = 30.243 ± 0.035 d (La Parola et al. 2010), and also never triggered the Swift/BAT.
2.6. IGR J16479−4514
The object IGR J16479−4514 was discovered on 2003 August 8–9 (Molkov et al. 2003) during an outburst that reached ~12 mCrab (18–25 keV) and ~8 mCrab (25–50 keV). Since then the source has shown frequent flaring activity, as recorded by both INTEGRAL (Sguera et al. 2005, 2006; Walter & Zurita Heras 2007) and Swift (Kennea et al. 2005; Markwardt & Krimm 2006; Romano et al. 2008, 2009e; Bozzo et al. 2009). It is associated with an O8.5I star at a distance of 4.9 kpc (Rahoui et al. 2008).
The orbital period Porb = 3.3194 ± 0.0010 d was discovered by Jain et al. (2009) in the first 4 years of Swift/BAT data and RXTE/All Sky Monitor (ASM) data, and it is the shortest measured for an SFXT.
Bozzo et al. (2008c) reported an X-ray eclipse by the supergiant companion observed during a long XMM-Newton observation obtained after the 2009 March 19 outburst. Recently, a super-orbital modulation has been detected in the Swift/BAT light curve (Corbet & Krimm 2013b) at Psup = 11.880 ± 0.002 d.
2.7. XTE J1739−302: the SFXT class prototype
The transient XTE J1739−302 was discovered in August 1997 by RXTE (Smith et al. 1997, 1998), when it reached a peak flux of 3.6 × 10⁻⁹ erg cm-2 s-1 (2–25 keV), and has a long history of flaring activity recorded by INTEGRAL (Sguera et al. 2006; Walter & Zurita Heras 2007; Blay et al. 2008) and by Swift (Sidoli et al. 2009c,a; Romano et al. 2011a; Farinelli et al. 2012). It is now considered a prototype of the SFXT class. The optical counterpart is an O8Iab(f) star (Negueruela et al. 2006a) at a distance of 2.7 kpc (Rahoui et al. 2008).
Drave et al. (2010) reported the discovery of a Porb = 51.47 ± 0.02 d orbital period based on ~12.4 Ms of INTEGRAL data. We note however that this period was not independently confirmed by an RXTE investigation (Smith et al. 2012) and a hint of a periodicity at Porb = 12.8658 ± 0.0073 d (1/4 of the value above) was reported by Romano et al. (2009e).
The properties of the quiescent state of XTE J1739−302 are described in Bozzo et al. (2010). As observed in IGR J08408−4503, the flaring behaviour extends down to 4.7 × 10⁻¹³ erg cm-2 s-1 (0.5–10 keV, or a luminosity of 4.1 × 1032 erg s-1).
2.8. IGR J17544−2619: the SFXT class prototype
The first 2-h flare from IGR J17544−2619 was observed by INTEGRAL on 2003 September 17 (Sunyaev et al. 2003), when the source reached a flux of 160 mCrab (18–25 keV). Several more flares, lasting up to 10 h, were detected by INTEGRAL in the following years (Grebenev et al. 2003, 2004; Sguera et al. 2006; Walter & Zurita Heras 2007; Kuulkers et al. 2007) with fluxes up to 400 mCrab (20–40 keV), and some were found in archival BeppoSAX observations (in’t Zand et al. 2004). Subsequent flares were observed by Swift (Krimm et al. 2007; Sidoli et al. 2009c,a; Romano et al. 2011a,b; Farinelli et al. 2012) and Suzaku (Rampy et al. 2009, which caught ≳day-long an outburst), so that IGR J17544−2619 is now considered a prototype of the SFXT class. The optical counterpart is an O9Ib star (Pellizza et al. 2006) at 3.6 kpc (Rahoui et al. 2008).
Clark et al. (2009) reported the discovery of a 4.926 ± 0.001 d orbital period based on the ~ 4.5 years of INTEGRAL data, while Drave et al. (2012) reported a pulsation at 71.49 ± 0.02 s from the region around the source that they attribute to a spin period.
The first detailed observations of an SFXT in quiescence were performed on this source. in’t Zand (2005) reported a Chandra observation where the source is characterized by a very soft (Γ = 5.9 ± 1.2) quiescent (L ~ 5 × 1032 erg s-1) spectrum. The initial state of quiescence is then followed by a bright outburst, implying a dynamical range of at least 4 orders of magnitude in observed flux. These observations prompted Bozzo et al. (2008b) to interpret the very large luminosity ranges observed on timescales as short as hours as transitions across the magnetic and/or centrifugal barriers, thus envisioning a scenario in which SFXTs with large dynamic range and large Pspin ≳ 1000 s are characterized by magnetar-like fields (B ≳ 1014 G).
2.9. SAX J1818.6−1703
The source SAX J1818.6−1703 was discovered on 1998 March 10–12 with the Wide Field Cameras on board BeppoSAX (in’t Zand et al. 1998) as a hard transient that reached 100 mCrab in the 2–9 keV band and 400 mCrab in 9–25 keV band. Several more bright flares lasting 1–3 h were observed (Grebenev & Sunyaev 2005; Sguera et al. 2005) with IBIS/ISGRI on board INTEGRAL reaching ~200 mCrab at the flare peak (18–45 keV), and with RXTE/ASM (Sguera et al. 2005). Bozzo et al. (2008a) estimated a dynamic range of 4 orders of magnitude. Further activity has been caught both by INTEGRAL (Grebenev & Sunyaev 2008) and Swift (Sidoli et al. 2009b; Romano et al. 2009c,b). Negueruela & Smith (2006) proposed an association with 2MASS J18183790−1702479 (USNO-B1.0 0729−0750578), a supergiant star with an earlier than B3 spectral type, which was later confirmed by a Chandra observation (in’t Zand et al. 2006). The spectral type was refined to O9-B1I (Negueruela & Schurch 2007) and then to B0.5Iab at a distance of 2.1 ± 0.1 kpc (Torrejón et al. 2010).
Bird et al. (2009) and Zurita Heras & Chaty (2009) discovered an orbital periodicity of 30 ± 0.1 d from the analysis of available Swift/BAT and INTEGRAL data, suggesting an eccentric orbit (e ~ 0.3–0.4) and a typical outburst duration of 4–6 days.
2.10. AX J1841.0−0536
The object AX J1841.0−0536 was discovered during ASCA observations of the Scutum arm region that were performed on 1994 April 12 and 1999 October 3–4 as a flaring source, which exhibited flux increases by a factor of 10 (up to ~10-10 erg cm-2 s-1) with rise times on the order of 1 h (Bamba & Koyama 1999; Bamba et al. 2001), a strong absorption NH = 3 × 1022 cm-2, and coherent pulsations with a period of 4.7394 ± 0.0008 s (but also see Bozzo et al. 2011). Rodriguez et al. (2004) later discovered IGR J18410−0535, which was observed to flare by INTEGRAL on 2004 October 8 and reached ~ 70 mCrab (20–60 keV) and 20 mCrab (60–200 keV) and was subsequently identified with AX J1841.0−0536 (Halpern & Gotthelf 2004). The infrared (IR) counterpart is 2MASS 18410043−0535465, a reddened star with a weak double-peaked Hα emission line, which was initially classified as a Be star, but later reclassified as B1Ib type star (Nespoli et al. 2008). This corroborated the evidence that AX J1841.0−0536 is a member of the SFXT class, as proposed by Negueruela et al. (2006b), at a distance of  kpc (Nespoli et al. 2008).
Several flares have been seen by INTEGRAL (Sguera et al. 2006, 2009), MAXI (Negoro et al. 2010), Swift (e.g. Romano et al. 2011b), and XMM-Newton (Bozzo et al. 2011). In particular, Bozzo et al. (2011) report evidence that the flare observed was produced by the accretion of a massive clump onto the compact object hosted in this SFXT.
Recently, AX J1841.0−0536 has been proposed as the prototype of a new class of Galactic transient MeV/TeV emitters due to it being a possible counterpart of 3EG J1837−0423 (Sguera et al. 2009).
2.11. AX J1845.0−0433
The source AX J1845.0−0433 was discovered in ASCA data (Yamauchi et al. 1995) as a source variable on timescales of tens of minutes (Sguera et al. 2007a; Zurita Heras & Walter 2009) and was classified as a SFXT with an O9.5I companion at a distance of 3.6 kpc (Coe et al. 1996). It also triggered the Swift/BAT (Romano et al. 2009a, 2012a, 2013). Recently, a modulation in the light curve has been observed in INTEGRAL data at 5.7195 ± 0.0007 d (Goossens et al. 2013) and attributed to an orbital period.
2.12. IGR J18483−0311
The transient IGR J18483−0311 was first detected during observations of the Galactic Centre on 2003 April 23–29, when it reached a flux of 10 mCrab in the 15–40 keV energy band and 5 mCrab in the 40–100 keV band (Chernyakova et al. 2003). Several flares were subsequently observed by INTEGRAL (Sguera et al. 2007b). Some of them exceeded one day in length and reached a peak flux of 120 mCrab. The source was first associated with a B0.5Ia star, located at a distance of 3–4 kpc (Rahoui & Chaty 2008), a classification later refined by Torrejón et al. (2010) to B0-B1Iab at 2.83 ± 0.05 kpc. It is probably the most active SFXT as observed by MAXI3.
An orbital period of 18.55 ± 0.03 d was discovered by Levine & Corbet (2006) in the RXTE/ASM data. Sguera et al. (2007b) discovered pulsations at Pspin = 21.0526 ± 0.0005 s with the X-ray monitor JEM-X (but see Ducci et al. 2013).
So far, IGR J18483−0311 only triggered the Swift/BAT once, and in that case, no NFI data were gathered. However, it was intensively observed with Swift/XRT between 2009 June 11 and July 9 (Romano et al. 2010) along the orbital period. The XRT light curve shows an orbital modulation and the flaring as characteristic of SFXTs. By assuming an eccentricity of e = 0.4, Romano et al. (2010) could explain their X-ray emission in terms of the accretion from a spherically symmetric clumpy wind, composed of clumps with different masses which range from 1018 to 5 × 10²¹ g.
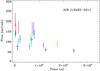 |
Fig. 1 Example of on-board data: 15–50 keV light curve of IGR J18483−0311. The red points are drawn from 64 s images, the green ones from 320 s images, and the blue ones from other (generally longer) timescale images. |
3. Analysis and results
3.1. BAT data subsamples
For each source in the BAT Transient Monitor (BATTM), the data products are two light curves: daily average and orbit-level (averaging ~ 800 s). Krimm et al. (2013) consider a source detected if it meets either of the following criteria: the mean rate has a value M ≳ 3 mCrab, and the peak rate for days when the source was found at ≳7σ to be P7 ≳ 30 mCrab. New sources are generally announced to the astronomical community through GCN if they are observed at ≳6σ for two or more days in the 1-day mosaics or at ≳6σ in a multi-day mosaic. The announcement is automatic whenever a source reaches ≳8σ. SFXTs are “known” sources; therefore, no automatic announcements are generally made but an Astronomer’s Telegram4 is issued upon examination of interesting events.
For this paper, we have collected all detections in excess of 5σ from both daily- and orbital-averaged BATTM light curves in the time range of 2005 February 12 to 2013 May 31 (MJD 53 413–56 443). Hereafter, these two subsamples are denoted by (D) and (o), respectively.
As described in Fenimore et al. (2003), the BAT on-board trigger algorithm works on several different timescales. The triggering code has three types of triggers: two are based on increases of count rates (short rate triggers on timescales of 4–64 ms; long rate triggers on timescales of 64 ms–24 s), and one is based on images (image triggers, on timescales of 64 s to many minutes). In the latter case, each image is searched for significant sources, but Swift does not slew to known sources unless the image flux exceeds a threshold set in the on-board source catalogue. The on-board source thresholds are set high in most cases but are manually set to low values for SFXTs, so that Swift will slew to them when they become active. An example of the on-board data is shown in Fig. 1, which shows the 15–50 keV light curve of IGR J18483−0311 during a very active day, 2007 September 21. The red points are derived from 64 s images, the green ones from 320 s images, and the blue ones from other (generally longer) timescale images that are generated and analysed on board by BAT when it is not responding to detected rate increases. The superposition of the times is due to the image detection algorithm.
For this work, we considered all on-board detections (≳5σ) as recorded in the same time span and selected those within 4 arcmin of each source in our sample. Hereafter, this subsample is denoted by (d).
Given the cut in σ applied to the available BATTM and on-board detections, our catalogue is a flux limited sample of flares. Assuming a Crab-like spectrum (power-law of photon index 2.15), 5σ detections for one day and an average orbit typically correspond to fluxes of 5.98 × 10⁻¹⁰ and 1.46 × 10⁻⁹ erg cm-2 s-1, respectively, in the 15–150 keV band (or 3.38 × 10⁻¹⁰ and 8.24 × 10⁻¹⁰ erg cm-2 s-1 in the 15−50 keV band). We note that the Crab produces a count rate of 0.22 counts cm-2 s-1 in the BAT (15–50 keV band, on-axis) or a flux of 1.3 × 10⁻⁸ erg cm-2 s-1.
On-board triggers and detections throughout the Swift mission (2005-02-12 to 2013-05-31).
First 15 entries of the 100-month Swift catalogue of SFXTs.
Table 3 summarizes our results and reports for each source the total number of detections in the daily- and orbital-averaged light curves (Cols. 3 and 4, marked as “D” and “o”) and the on-board detection (Col. 5, “d”). As typical of SFXTs, for a given source several detections occur on the same date; therefore, we also provide the total number of days the source was detected in the orbital-averaged light curves and on board in parenthesis in Cols. 4 and 5 of Table 3. For completeness, we also report the total number of BAT triggers, that is the instances when the significance was high enough to trigger the BAT and initiate the typical Swift GRB follow-up response (Col. 2, “T”).
In Tables A.1–A.11, we report the results on individual sources, as an abridged list of detections – we selected the brightest flare for each day the source was detected – as marked by an (o) and (d), for orbital-averaged and on-board detection, respectively. The detections from the daily-averaged BATTM light curves are marked by a (D). In Tables A.1–A.11, we also report the subsample of BAT triggers, marked by a (T), along with the trigger number (Col. 6).
The full catalogue file contains the following fields: unique line identifier (Col. 1); source name (Col. 2); a flag (Col. 3) discriminating the detection method (T = BAT trigger, D = from daily-averaged BATTM light curves, o = from orbital-averaged BATTM light curves, d = from on-board detections); year, day of year (DOY) and MJD (Cols. 4–6); UT date and time (Cols. 7, 8); flare duration (Col. 9); significance of the detection in units of σ (Col. 10); mean flux in mCrab (Col. 11); and trigger number (Col. 12 for BAT triggers). The first 15 lines are reported in Table 4.
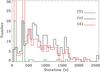 |
Fig. 2 Distributions of the flare durations for BAT triggers (T), orbital-averaged BATTM light curves (o), and on-board detections (d) in units of seconds, drawn from the full catalogue. The peaks at 64 and 320 s reach ~270 and 250, respectively. |
3.2. Flare ensemble properties
Our sample comprises a total of 1117 flares from 11 sources. They are divided into 46 BAT triggers (T, in 43 outbursts), 126 daily-averaged BATTM light curves (D), 267 orbital-averaged BATTM light curves (o), and 678 on-board detections (d).
Figure 2 shows the distributions of the observed durations. The means are 285 s (T), 897 s (o), 351 s (d); and their medians are 320 s (T) and 792 s (o). We note that most on-board detections of SFXT flares result from the (nominally) 64 s, 320 s, and full-pointing images that BAT generates. The image duration is used as a proxy for the flare duration, leading to the two peaks in Fig. 2.
Figure 3 shows the distributions of the observed 15–50 keV fluxes for the whole catalogue, depending on the detection method. The fluxes range from ~15 mCrab (for the daily-averages) to 1.9 Crab (a bright BAT trigger of IGR J08408−4503) with a median of ~105 mCrab. The medians for the four subsamples are 134 mCrab (T), 27 mCrab (D), 94 mCrab (o), and 133 mCrab (d). The two peaks of the on-board (d) subsample are at ~95 and 175 mCrab and are due to the detections in the 320 and 64 s on-board images, respectively.
Figure 4 shows the flux distributions for individual sources. We note that we can determine the prevailing timescale for on-board detection when a sufficiently high number of on-board flares is available, as in the case of IGR J16479−4514, XTE J1739−302, and IGR J18483−0311. While the two peaks in the flux distributions (corresponding to on-board detections in the 320 and 64 s timescales) are equivalent for IGR J16479−4514 (Fig. 4c), there is a marked preference for the 64 s peak in XTE J1739−302 (Fig. 4d) and for the 320 s peak in IGR J18483−0311 (Fig. 4i). This means that the on-board data imply a flare length ≳64 s for XTE J1739−302 and a flare length ≳320 s for the other two.
The flux distributions imply that the population of about a thousand SFXTs flares we observed is characterized by short (a few hundred seconds) and relatively bright (in excess of 100 mCrab, 15–50 keV) events. We note that these flares generally last less than a day in the hard X-ray, as demonstrated by the lower fluxes measured in the BATTM daily averages. As we have shown (e.g. Romano et al. 2007b, 2011b, and references therein), in the soft X-ray the picture is radically different, as the higher sensitivity of the focussing instrumentation allows us not only to detect the bright flares but also to follow the whole outburst, lasting up to several days, depending on the source. Clustering of X-ray flares, however, can also be used to indirectly measure the length of an outburst, even though the low-level emission is not detected, as we shall see in the following sections.
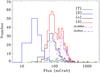 |
Fig. 3 Distributions of the flare fluxes (15–50 keV, in units of mCrab) for BAT triggers (T), daily-averaged BATTM light curves (D), orbital-averaged BATTM light curves (o), and on-board detections (d), which are drawn from the full catalogue. The dotted and dashed histograms represent the on-board detections lasting 320 and 64 s and are responsible for the two peaks in the (d) overall distribution at ~95 and 175 mCrab, respectively. |
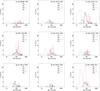 |
Fig. 4 Distributions of the flare fluxes (15–50 keV) for the individual sources for BAT triggers (T), daily-averaged BATTM light curves (D), orbital-averaged BATTM light curves (o), and on-board detections (d) in units of mCrab, drawn from the full catalogue, ordered by right ascension. |
3.3. Orbital distribution of flares
The orbit-averaged BATTM light curves were screened to exclude bad quality points (quality flag > 0) and referred to the solar system barycentre (SSB) by using the ftools task earth2sun.
For the sources with no known orbital period (IGR J08408−4503 and AX J1841.0−0536), we searched for periodicities in the orbit-averaged BATTM light curves within 2–1000 d. Since the light curves were non-uniformly spaced (due to the gaps when the source was Sun-constrained), we applied the fast Lomb-Scargle periodogram technique (Press & Rybicki 1989; Scargle 1982; Lomb 1976). For each light curve, we estimated the number of independent frequencies in the periodograms using Eq. (13) of Horne & Baliunas (1986). No statistically significant periodicities were detected.
For those sources for which an orbital period is already known (9/11), we performed a standard folding analysis on the BATTM orbit-averaged light curves. Table 5 shows the periods found from our analysis for IGR J16465−4507, IGR J16479−4514, IGR J17544−2619, SAX J1818.6−1703, and IGR J18483−0311, where the uncertainties quoted are the errors derived by a Gaussian fit of the peak centroid.
The ones found for the remainder of the sample (4/9) were consistent with the values reported in Table 2, so those values were adopted, instead.
For all sources with a known period, we also considered the full catalogue of flares (Sect. 3.1), and we folded them with the same parameters as the BATTM light curves.
Figure 5 (top panels) shows the BATTM orbital-averaged light curves folded at the periods reported in Table 5. The distributions of flares along the orbital period are plotted in the bottom panels of Fig. 5 with a black line marking detections in the orbit-averaged light curves (o), a red line marking on-board detections (d), and green downward pointing arrows marking the BAT triggers (T). The histogram bins correspond for each source and for each kind of datum to the maximum observed exposure during which each detection was achieved.
Figure 6 shows, as a function of orbital phase, the significance of each detection (in units of σ) and the flux of the detections (in units of mCrab).
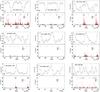 |
Fig. 5 Top panels: BAT TM light curves (15–50 keV) of the SFXT sample folded at the periods reported in Table 5, ordered by orbital period (reported in the right lower corner of each panel). Bottom panels: BAT on-board detections (d, red histograms) and BATTM orbital detections (o, black histograms) folded at the same periods. The green downward-pointing arrows are the BAT triggers (T). |
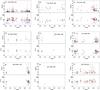 |
Fig. 6 Top panels: flare significance (in units of σ) as a function of orbital phase (periods in Table 5). Green triangles mark the BAT triggers (T), blue diamonds the BATTM daily detections (D), black stars the BATTM orbital detections (o), red crosses the on-board detections (d). Bottom panels: flare flux (in units of mCrab) as a function of orbital phase. The typical relative error on flux is ~15%. |
3.4. Results for individual objects
The least active sources in our sample are IGR J16465−4507 and IGR J16328−4726, as shown in Table 3. With their orbital periods of ~30 and ~10 d, only 30 and 169 orbital cycles were observed, respectively and, as Figs. 5h,e and 6h,e show, no conclusions can be drawn on the distribution of the few flares as a function of orbital phase.
The analysis of the data on AX J1845.0−0433 (Figs. 5d and 6d) that was followed for 463 cycles yields no marked preference with phase for the flare distributions and the BAT triggers, which occur at phase 0.09, 0.46, and 0.81.
For IGR J08408−4503 no orbital period is firmly known, despite an initial hint of a periodicity in the outbursts (Romano et al. 2009d) at about 35 d with possible sub-periodicities at 11 and 24 d. With the current dataset this trend cannot be verified as the latter flares deviate from this pattern. By examining the distribution of flares in time, we note however that they do tend to cluster in outbursts with episodes of prolonged duration up to a day (see Col. 5 of Table 3). This is consistent with a multiple-flare structure of each outburst, as observed first in 2008 (Romano et al. 2009d).
The orbital period of AX J1841.0−0536 is similarly unknown. The four BAT triggers for this object are 383.9, 356.2, and 39.2 d apart, and several flares cluster around them. The clustering is not as strong as in IGR J08408−4503, so that there are detections well away from the BAT triggers. We also know that this source is very active in the soft X-ray band, and indeed it has a very low inactivity duty cycle (IDC)5 of 28%, as shown in Romano et al. (2009e, Fig. 1d and Table 2). Given the currently scanty information, one can only speculate that an orbital period of about 3 d, which is comparable to that of IGR J16479−4514 (which has an inactivity duty cycle of 19%, Romano et al. 2011a), would not only be consistent with all triggers and the day-long activity around each trigger but would also be consistent with the relatively high soft X-ray duty cycle, as appropriate for a tight, almost circular, orbit around the supergiant companion.
The transient IGR J16479−4514 is by far the most active source in our sample (see Table 3). During the 891 cycles it was observed with the BAT, the source is detected at all orbital phases (Figs. 5a and 6a) at both the daily-average and orbital-average levels, except during the eclipse (φ = 0.5–0.6). This distribution closely matches that of the BATTM folded light curve. Furthermore, the BAT triggers cluster around the extremely narrow ranges of φ = 0.88–0.90 (5/8, including the most significant in terms of σ) and 0.26–0.29 (2/9), which closely match the detailed peaks of the BATTM folded light curve, while one trigger occurs at φ = 0.67 (Fig. 6a). The picture we can draw from this information, combined with the high activity duty cycle in the soft X-ray (Romano et al. 2011a), is that of an orbit with mild eccentricity well within the accretion region that is determined by the wind of the supergiant companion.
The source IGR J16418−4532 (Figs. 5b and 6b) has a similar behaviour as IGR J16479−4514, which is not surprising, given the very similar orbital periods, with flares at all phases that match the BATTM folded light curve (794 cycles), including the deep eclipse at φ = 0.5–0.6. The BAT triggers concentrate in phase around about 0.4 and 0.9.
The source XTE J1739−302 (Figs. 5i and 6i) was only followed for 58 cycles, given the long orbital period. It is as active as IGR J16479−4514 (see Table 3) and shows flares (from daily- and orbital-averaged and on-board data) and BAT triggers observed at all orbital phases.
The three remaining sources, IGR J17544−2619, SAX J1818.6−1703, and IGR J18483−0311, show a conspicuous clustering of the flares at specific phases. The prototypical SFXT IGR J17544−2619 (Figs. 5c and 6c) shows distributions of daily-, orbital-averaged, and on-board detections that closely match the one of the BATTM folded light curve (constructed from 504 cycles). In particular, there is a clustering of flares at φ = 0.7–1, which includes the most significant ones (Fig. 6c) and corresponds to ~1.5 d around what is probably the periastron. This is consistent with the findings of Clark et al. (2009). The BAT triggers also follow the same distribution, mainly occurring at periastron (with one exception).
The transient SAX J1818.6−1703 (Figs. 5g and 6g) is also characterized by a distribution of flares closely matching the BATTM light curve (84 cycles), which includes the clustering of flares at φ = 0.85–1.05 corresponding to ~6 d. This is comparable to the width of the peak in the BATTM folded light curve and consistent with the findings of Bird et al. (2009), who observed that SAX J1818.6−1703 shows a duty cycle of 4–6 d during a 30 d period.
The source IGR J18483−0311 (Figs. 5f and 6f) is generally considered an SFXT with an intermediate dynamical range and also shows a tight match between the distribution of flares and the BATTM light curves (162 cycles). We observe a strong clustering in phase of flares at φ = 0.87–1.1, which corresponds to ~4.3 d. This is comparable to the width of the peak in the BATTM folded light curve, presumably the periastron. This is consistent with the structure of the folded light curve observed in the soft X-ray (Romano et al. 2010) and is indicative of a large orbit with some eccentricity, as derived by Romano et al. (2010), who find e = 0.4 by modelling the soft X-ray light curve with the Ducci et al. (2009) clumpy wind model.
4. SFXT perspectives for future missions
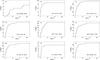 |
Fig. 7 Cumulative distributions of σ for BATTM orbital detections (corresponding to (o) in Figs. 5 and 6) for our 100 months of data collected with BAT. We note that 5σ detections for an average orbit correspond to 1.46 × 10⁻⁹ erg cm-2 s-1 in the 15–150 keV band (8.24 × 10⁻¹⁰ erg cm-2 s-1, 15–50 keV). We also note that the typical duration for an average orbit is 800 s for our sample. |
As an interesting application of this work, our catalogue can be used to estimate the outcomes of and plan observations of SFXTs from future hard X-ray observatories, in particular for those carrying a wide field of view (FOV) monitor.
We consider the fraction of days on which the source was in the BAT FOV as a good proxy for observability. Indeed, for each source, BAT made at least some observations on a fraction of days that varies from source to source but is typically ~90%. The primary cause of long observational gaps were Sun constraints on the pointing direction of Swift, so we call this overall fraction the “seasonal visibility”. In Table 6 we report the expected number of flares for the sources in our sample for a 5-year baseline. This number was corrected for the seasonal visibility. Preliminary results of our work were indeed used for LOFT (Feroci et al. 2012) simulations (Bozzo et al. 2013). We note that the accuracy of the expected number of flares is strongly dependent on the actual number of observed flares it is based upon.
Furthermore, Fig. 7 shows the cumulative distributions of σ for the BATTM orbital detections. By considering that 5σ detections for an average orbit correspond to 1.46 × 10⁻⁹ erg cm-2 s-1 in the 15–150 keV band (8.24 × 10⁻¹⁰ erg cm-2 s-1, 15–50 keV), the individual plots can be used to predict the number of flares for a given limiting flux. For instance, let us estimate the number of flares in excess of 100 mCrab (15–50 keV). This flux corresponds to 7.75σ in the 15–50 keV band at the orbital-averaged level (see Sect. 3.1) or a flux of 2.3 × 10⁻⁹ erg cm-2 s-1 in the 15–150 keV band (4.0 × 10⁻⁹ erg cm-2 s-1, 15–50 keV). From Fig. 7c we derive for IGR J16479−4514 that 61 flares are below 7.75σ and that 75 − 61 = 14 flares are above 7.75σ. After correction for the seasonal visibility, we thus obtain 10 flares during a 5-year mission. By adopting the same procedure for the whole sample, in a 5-year mission we expect a total of 32 flares in excess of 100 mCrab. Similarly, for a 5-year mission, we obtain 48 flares in excess of 90 mCrab (6.98σ), 73 flares in excess of 80 mCrab (6.20σ), and 130 flares in excess of 70 mCrab (5.43σ).
Expected number of flares in excess of 1.46 × 10⁻⁹ erg cm-2 s-1 (15–150 keV band) for a 5-year mission from the SFXT sample.
We note that our expectations are conservative lower limits, as they are based on the currently known population of SFXTs, which is bound to increase as the surveys of the Galactic plane become deeper and outbursts of new SFXTs are observed.
5. Discussion
The mechanisms responsible for the bright short outbursts in SFXTs are still not known well. The most credited models can be roughly divided in two categories: i) models for which the X-ray variability exclusively depends on the properties of the geometry and inhomogeneity of the stellar wind from the donor star; and ii) models in which the accretion mechanisms which link the observed high dynamic ranges to the properties of the compact object can be explained by assuming only modest inhomogeneities in the density and/or velocity in the supergiant wind.
In the spherically symmetric clumpy wind model, the short flares are produced by accretion of massive clumps (1022–1023 g) in the supergiant winds (e.g. in’t Zand 2005; Negueruela et al. 2008; Walter & Zurita Heras 2007), which are believed to be strongly inhomogeneous (e.g. Oskinova et al. 2007) with large density contrasts (104–105). In this model, SFXTs should have generally wider orbits than persistent HMXBs (Negueruela et al. 2008; Chaty 2008). In particular, a key prediction is strong variations in the column density, which have recently been observed in IGR J17544−2619 (Rampy et al. 2009), IGR J08408−4503 (Romano et al. 2009d) and, most spectacularly, in AX J1841.0−0536 (Bozzo et al. 2011). For Sidoli et al. (2007), the outbursts can be due to the presence of an equatorial wind component, denser, possibly clumpy, and slower than the symmetric polar wind from the blue supergiant, which is inclined with respect to the orbital plane of the system. This could be the case of IGR J11215–5952 (Sidoli et al. 2007). Ducci et al. (2009) developed a more detailed clumpy stellar wind model (considering both spherical and non-spherical geometry) for OB supergiants in HMXBs, which assumes that a fraction of the wind is in clumps with power-law mass and size distributions. This model allows a direct comparison to the X-ray properties derived from the light curves of both SFXTs and persistent HMXBs and was successfully applied to IGR J08408−4503, IGR J18483−0311, and IGR J16418−4532 (Romano et al. 2009d, 2010, 2012b, respectively).
Alternatively, the high dynamic range in SFXTs can be explained without invoking large variations in the density and/or velocity of the supergiant wind in terms of gated mechanisms (Stella et al. 1986; Grebenev & Sunyaev 2007; Bozzo et al. 2008b), due to which the accretion flow is halted by a magnetic or a centrifugal barrier, dependent on the properties of the NS, its Pspin, and the strength of its magnetic field B. In particular, as this model works well for the SFXT prototype IGR J17544−2619, Bozzo et al. (2008b) conclude that the high observed dynamic range can be produced in SFXTs provided they host neutron stars with long Pspin ≳ 1000 s and magnetar-like B ≳ 1014 G fields.
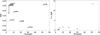 |
Fig. 8 Left panel: mean absolute deviation of the flare phases as a function of orbital period. Right panel: mean absolute deviation of the flare phases multiplied by the orbital period as a function of orbital period. The dataset is that of orbital detections (o, filled black triangles). The empty triangles are obtained by simulating a population of flares for IGR J16479−4514 and IGR J16418−4532 unaffected by the presence of the eclipse. |
In this paper, we have examined over a thousand detections from 11 SFXTs, the great majority of confirmed SFXTs, as observed by Swift/BAT in the hard X-ray during the first 100 months of its mission. Since we have applied a 5-σ cut to the available BATTM and on-board detections, our catalogue is a flux limited sample of flares, which is complete down to 15–150 keV fluxes of ~6 × 10⁻¹⁰ erg cm-2 s-1 (daily timescale) and ~1.5 × 10⁻⁹ erg cm-2 s-1 (orbital timescale, ~ 800 s). For the first time, therefore, it is possible to consider this homogeneous set of data to try to address long standing issues related to the nature of their emission.
Our sample of flares shows marked differences in behaviour among individual objects in terms of both overall activity, (i.e., number of flares observed, their intensity and duration, Table 3, Figs. 4 and 2) and clustering of the flares in phase. The distribution of flare fluxes (Fig. 4) in the 15–50 keV energy band show that they range from ~15 mCrab to about 2 Crab (1.9 × 10⁻¹⁰–2.5 × 10⁻⁸ erg cm-2 s-1), which corresponds to luminosities of L15 − 50 keV ~ 6 × 1035 erg s-1 to L15 − 50 keV ~ 7 × 1037 erg s-1 (assuming a common distance of 5 kpc, which is the average of the sample in Table 1). The median flux is ~ 105 mCrab, which corresponds to L15 − 50 keV ~ 4 × 1036 erg s-1. In the clumpy stellar wind scenario, flares with luminosities of 1036–1037 erg s-1 and durations of hours can be produced by the accretion of clumps of wind with mass of 1022 − 23 g (Walter & Zurita Heras 2007).
The distribution of the flare durations (Fig. 2 and 1) shows that they range from a few minutes up to a few hours. In the clumpy wind models, luminosity variations can occur on timescales of the order of hours, the time required for the accretion of individual clumps, or the crossing time of the NS through the equatorial plane (in the model proposed by Sidoli et al. 2007). In the gating mechanisms scenario, transitions across the NS regimes are caused by small variations in the wind local density (Grebenev & Sunyaev 2007; Bozzo et al. 2008b), which also occur on timescales of the order of hours. Therefore, the durations of the BAT flares do not allow us to discriminate between the two scenarios.
Another issue we can tackle is the impact of the binary geometry on the overall hard X-ray emission. Figure 5 shows the distribution of flares with the orbital phase with the objects ordered by length of the orbital period Porb. As stated in detail in Sect. 3.3, little can be inferred for IGR J16465−4507 and IGR J16328−4726 due to the low number of flares. However, we note a definite trend in the clustering of flares for the remainder of the objects. Sources with very short periods (IGR J16479−4514 and IGR J16418−4532, Porb ~ 3 d) are detected at all orbital phases at both the daily-average and orbital-average level, except during their eclipse (at φ = 0.5–0.6). In combination with the observed soft X-ray properties of a high activity duty cycle (Romano et al. 2011a, 2012b), this is clearly consistent with a tight circular or mildly eccentric orbit, well within the accretion region determined by the wind of the supergiant companion. As Porb increases, we note that the clustering of flares with phase becomes more and more pronounced, as can be best seen in the case of IGR J18483−0311 and SAX J1818.6−1703 (Porb ~ 18 and 30 d, respectively), which can be readily explained in terms of larger and probably more eccentric orbits. The only exception to this trend is XTE J1739−302, whose properties of a large number of flares observed at all phases, and a high soft X-ray activity duty cycle (Romano et al. 2011a), would be more similar to those of a short period binary (such as IGR J16479−4514) than to a binary with a long Porb ~ 51 d. Similarly, if we considered AX J1841.0−0536, whose orbital period is still unknown, we could speculate that an orbital period of about 3 d (comparable to that of IGR J16479−4514) would not only be consistent with all observed BAT triggers and the day-long activity around each trigger but also with the relatively high soft X-ray duty cycle (Romano et al. 2009e), which is typical of a tight, almost circular, orbit around the supergiant companion.
To better quantify these statements, we calculated the mean absolute deviation (MAD)6 of the flare phases for each source with known orbital period. The MAD multiplied by the orbital period can be considered a good proxy for the half-length of the duty-cycle. Figure 8 (left panel) shows the MAD, where the black points are derived using all orbital detections, while the green ones are the MAD values we obtained by simulating a population of flares for IGR J16479−4514 and IGR J16418−4532 unaffected by the presence of the eclipse (by “filling” the eclipses with flares randomly chosen among the observed distribution). Figure 8 (right) reports the MAD multiplied by the orbital period, and it shows that the duty-cycle is in the order of a few days. In both panels of Fig. 8, XTE J1739−302 is a clear outlier, thus suggesting that the ~ 51 d period may not be the orbital period but possibly a superorbital period, such as were recently discovered for IGR J16479−4514 and IGR J16418−4532 (Corbet & Krimm 2013b).
Clumpy wind and gating mechanism models can both explain the observed increase of clustering of flares with the eccentricity. In both scenarios, the clustering of flares is expected at the periastron passage, where the number density of clumps is larger (compared to the apastron region) and the higher mass accretion rate ( , where ρ is the wind density and vrel is the relative velocity between the NS and the wind; e.g. Waters et al. 1989) can open the centrifugal/magnetic barriers, leading to direct accretion.
6. Summary
We have presented a catalogue of over a thousand BAT flares on 11 SFXTs, down to 15–150 keV fluxes of ~6 × 10⁻¹⁰ erg cm-2 s-1 (daily timescale) and ~1.5 × 10⁻⁹ erg cm-2 s-1 (orbital timescale, averaging ~800 s) spanning the initial 100 months of the Swift mission. We showed that these flares, which are for the large majority previously unpublished, are short (a few hundred seconds, as predicted by all models for SFXT outburst emission) and relatively bright (in excess of 100 mCrab, 15–50 keV) events, lasting much less than a day in the hard X-ray. The outbursts are, however, as shown by the clustering of flares in phase space, a much longer phenomenon, lasting up to a few days, as previously discovered from deeper soft X-ray observations (e.g. Romano et al. 2007b, 2011b, and references therein). In particular, we observe a trend of clustering of flares at some phases as Porb increases, which is consistent with a progression from tight circular or mildly eccentric orbits at short periods, to wider and more eccentric orbits at longer orbital periods.
This large dataset (the largest in a single publication) can be used to further probe the properties of the high and intermediate emission states in SFXTs, and to infer the properties of these binary systems, especially in conjunction with flares detected by other current or future missions. For the latter, we have also provided a simple recipe to estimate the number of flares per year each source is likely to produce as a function of detection threshold/limiting flux.
See the MAXI notices at http://maxi.riken.jp/pipermail/x-ray-star/
The inactivity duty cycle is defined in Romano et al. (2009e) for a sample of four SFXTs as the time each source spends undetected down to a flux limit of 1–3 × 10-12 erg cm-2 s-1, depending on the source.
Mean absolute deviation =  where
where  is the mean of x = (x1,...,xN).
Acknowledgments
We thank W. Baumgartner and C. Markwardt for support with the BAT survey products, and E. Bozzo and M. Capalbi, for helpful discussions. We also thank the anonymous referee for constructive comments that helped improve the paper. We acknowledge financial contribution from NASA contract NAS5-00136 at PSU. HAK acknowledges NASA Swift GO grants NNX09AU85G, NNX12AD32G, NNX12AE57G, and NNX13AC75G. This work made use of the results of the Swift/BAT hard X-ray transient monitor: http://swift.gsfc.nasa.gov/docs/swift/results/transients/.
References
- Bamba, A., & Koyama, K. 1999, IAU Circ., 7324, 4 [NASA ADS] [Google Scholar]
- Bamba, A., Yokogawa, J., Ueno, M., Koyama, K., & Yamauchi, S. 2001, PASJ, 53, 1179 [NASA ADS] [CrossRef] [Google Scholar]
- Barthelmy, S. D., Barbier, L. M., Cummings, J. R., et al. 2005, Space Sci. Rev., 120, 143 [NASA ADS] [CrossRef] [Google Scholar]
- Bird, A. J., Malizia, A., Bazzano, A., et al. 2007, ApJS, 170, 175 [NASA ADS] [CrossRef] [Google Scholar]
- Bird, A. J., Bazzano, A., Hill, A. B., et al. 2009, MNRAS, 393, L11 [NASA ADS] [Google Scholar]
- Blay, P., Martínez-Núñez, S., Negueruela, I., et al. 2008, A&A, 489, 669 [NASA ADS] [CrossRef] [EDP Sciences] [Google Scholar]
- Bodaghee, A., Tomsick, J. A., Rodriguez, J., et al. 2011, ApJ, 727, 59 [NASA ADS] [CrossRef] [Google Scholar]
- Bozzo, E., Campana, S., Stella, L., et al. 2008a, ATel, 1493 [Google Scholar]
- Bozzo, E., Falanga, M., & Stella, L. 2008b, ApJ, 683, 1031 [NASA ADS] [CrossRef] [Google Scholar]
- Bozzo, E., Stella, L., Israel, G., Falanga, M., & Campana, S. 2008c, MNRAS, 391, L108 [NASA ADS] [CrossRef] [Google Scholar]
- Bozzo, E., Giunta, A., Stella, L., et al. 2009, A&A, 502, 21 [NASA ADS] [CrossRef] [EDP Sciences] [Google Scholar]
- Bozzo, E., Stella, L., Ferrigno, C., et al. 2010, A&A, 519, A6 [NASA ADS] [CrossRef] [EDP Sciences] [Google Scholar]
- Bozzo, E., Giunta, A., Cusumano, G., et al. 2011, A&A, 531, A130 [NASA ADS] [CrossRef] [EDP Sciences] [Google Scholar]
- Bozzo, E., Pavan, L., Ferrigno, C., et al. 2012, A&A, 544, A118 [NASA ADS] [CrossRef] [EDP Sciences] [Google Scholar]
- Bozzo, E., Romano, P., Ferrigno, C., Esposito, P., & Mangano, V. 2013, Adv. Space Res., 51, 1593 [NASA ADS] [CrossRef] [Google Scholar]
- Burrows, D. N., Hill, J. E., Nousek, J. A., et al. 2005, Space Sci. Rev., 120, 165 [NASA ADS] [CrossRef] [Google Scholar]
- Chaty, S. 2008, Chin. J. Astron. Astrophys. Suppl., 8, 197 [Google Scholar]
- Chaty, S., Rahoui, F., Foellmi, C., et al. 2008, A&A, 484, 783 [NASA ADS] [CrossRef] [EDP Sciences] [Google Scholar]
- Chernyakova, M., Lutovinov, A., Capitanio, F., Lund, N., & Gehrels, N. 2003, ATel, 157 [Google Scholar]
- Clark, D. J., Hill, A. B., Bird, A. J., et al. 2009, MNRAS, 399, L113 [NASA ADS] [CrossRef] [Google Scholar]
- Clark, D. J., Sguera, V., Bird, A. J., et al. 2010, MNRAS, 406, L75 [NASA ADS] [Google Scholar]
- Coe, M. J., Fabregat, J., Negueruela, I., Roche, P., & Steele, I. A. 1996, MNRAS, 281, 333 [NASA ADS] [CrossRef] [Google Scholar]
- Coleiro, A., Chaty, S., Zurita Heras, J. A., Rahoui, F., & Tomsick, J. A. 2013, A&A, 560, A108 [NASA ADS] [CrossRef] [EDP Sciences] [Google Scholar]
- Corbet, R., & Krimm, H. 2013a, ATel, 5126, 1 [NASA ADS] [Google Scholar]
- Corbet, R. H. D., & Krimm, H. A. 2013b, ApJ, 778, 45 [NASA ADS] [CrossRef] [Google Scholar]
- Corbet, R., Barbier, L., Barthelmy, S., et al. 2006, ATel, 779, 1 [Google Scholar]
- Corbet, R. H. D., Barthelmy, S. D., Baumgartner, W. H., et al. 2010, ATel, 2588 [Google Scholar]
- Drave, S. P., Clark, D. J., Bird, A. J., et al. 2010, MNRAS, 409, 1220 [NASA ADS] [CrossRef] [Google Scholar]
- Drave, S. P., Bird, A. J., Townsend, L. J., et al. 2012, A&A, 539, A21 [NASA ADS] [CrossRef] [EDP Sciences] [Google Scholar]
- Drave, S. P., Bird, A. J., Sidoli, L., et al. 2013, MNRAS, 433, 528 [NASA ADS] [CrossRef] [Google Scholar]
- Ducci, L., Sidoli, L., Mereghetti, S., Paizis, A., & Romano, P. 2009, MNRAS, 398, 2152 [NASA ADS] [CrossRef] [Google Scholar]
- Ducci, L., Sidoli, L., & Paizis, A. 2010, MNRAS, 408, 1540 [NASA ADS] [CrossRef] [Google Scholar]
- Ducci, L., Doroshenko, V., Sasaki, M., et al. 2013, A&A, 559, A135 [NASA ADS] [CrossRef] [EDP Sciences] [Google Scholar]
- Farinelli, R., Romano, P., Mangano, V., et al. 2012, MNRAS, 424, 2854 [NASA ADS] [CrossRef] [Google Scholar]
- Fenimore, E. E., Palmer, D., Galassi, M., et al. 2003, in Gamma-Ray Burst and Afterglow Astronomy 2001: A Workshop Celebrating the First Year of the HETE Mission, eds. G. R. Ricker, & R. K. Vanderspek, AIP Conf. Ser., 662, 491 [Google Scholar]
- Feroci, M., Stella, L., van der Klis, M., et al. 2012, Exp. Astron., 34, 415 [NASA ADS] [CrossRef] [Google Scholar]
- Fiocchi, M., Sguera, V., Bazzano, A., et al. 2010, ApJL, 725, L68 [NASA ADS] [CrossRef] [Google Scholar]
- Fiocchi, M., Bazzano, A., Bird, A. J., et al. 2013, ApJ, 762, 19 [NASA ADS] [CrossRef] [Google Scholar]
- Gehrels, N., Chincarini, G., Giommi, P., et al. 2004, ApJ, 611, 1005 [NASA ADS] [CrossRef] [Google Scholar]
- Giunta, A., Bozzo, E., Bernardini, F., et al. 2009, MNRAS, 399, 744 [NASA ADS] [CrossRef] [Google Scholar]
- Goossens, M. E., Bird, A. J., Drave, S. P., et al. 2013, MNRAS, 434, 2182 [NASA ADS] [CrossRef] [Google Scholar]
- Götz, D., Schanne, S., Rodriguez, J., et al. 2006, ATel, 813, 1 [NASA ADS] [Google Scholar]
- Grebenev, S. A., & Sunyaev, R. A. 2005, Astron. Lett., 31, 672 [NASA ADS] [CrossRef] [Google Scholar]
- Grebenev, S. A., & Sunyaev, R. A. 2007, Astron. Lett., 33, 149 [NASA ADS] [CrossRef] [Google Scholar]
- Grebenev, S. A., & Sunyaev, R. A. 2008, ATel, 1482, 1 [Google Scholar]
- Grebenev, S. A., Lutovinov, A. A., & Sunyaev, R. A. 2003, ATel, 192, 1 [Google Scholar]
- Grebenev, S. A., Rodriguez, J., Westergaard, N. J., Sunyaev, R. A., & Oosterbroek, T. 2004, ATel, 252, 1 [NASA ADS] [Google Scholar]
- Grupe, D., Kennea, J., Evans, P., et al. 2009, ATel, 2075, 1 [NASA ADS] [Google Scholar]
- Halpern, J. P., & Gotthelf, E. V. 2004, ATel, 341, 1 [Google Scholar]
- Halpern, J. P., Gotthelf, E. V., Helfand, D. J., Gezari, S., & Wegner, G. A. 2004, ATel, 289, 1 [NASA ADS] [Google Scholar]
- Horne, J. H., & Baliunas, S. L. 1986, ApJ, 302, 757 [NASA ADS] [CrossRef] [Google Scholar]
- in’t Zand, J. J. M. 2005, A&A, 441, L1 [NASA ADS] [CrossRef] [EDP Sciences] [Google Scholar]
- in’t Zand, J., Heise, J., Smith, M., et al. 1998, IAU Circ., 6840, 2 [NASA ADS] [Google Scholar]
- in’t Zand, J., Heise, J., Ubertini, P., Bazzano, A., & Markwardt, C. 2004, in 5th INTEGRAL Workshop on the INTEGRAL Universe, eds. V. Schoenfelder, G. Lichti, & C. Winkler, ESA SP, 552, 427 [Google Scholar]
- in’t Zand, J., Jonker, P., Mendez, M., & Markwardt, C. 2006, ATel, 915, 1 [Google Scholar]
- Jain, C., Paul, B., & Dutta, A. 2009, MNRAS, 397, L11 [NASA ADS] [CrossRef] [Google Scholar]
- Kennea, J. A., Pagani, C., Markwardt, C., et al. 2005, ATel, 599, 1 [Google Scholar]
- Krimm, H. A., Barthelmy, S. D., Barbier, L., et al. 2007, ATel, 1265, 1 [NASA ADS] [Google Scholar]
- Krimm, H. A., Holland, S. T., Corbet, R. H. D., et al. 2013, ApJS, 209, 14 [NASA ADS] [CrossRef] [Google Scholar]
- Kuulkers, E., Oneca, D. R., Brandt, S., et al. 2007, ATel, 1266, 1 [NASA ADS] [Google Scholar]
- La Parola, V., Cusumano, G., Romano, P., et al. 2010, MNRAS, 405, L66 [NASA ADS] [CrossRef] [Google Scholar]
- Levine, A. M., & Corbet, R. 2006, ATel, 940, 1 [Google Scholar]
- Levine, A. M., Bradt, H. V., Chakrabarty, D., Corbet, R. H. D., & Harris, R. J. 2011, ApJS, 196, 6 [NASA ADS] [CrossRef] [Google Scholar]
- Leyder, J.-C., Walter, R., Lazos, M., Masetti, N., & Produit, N. 2007, A&A, 465, L35 [NASA ADS] [CrossRef] [EDP Sciences] [Google Scholar]
- Lomb, N. R. 1976, Ap&SS, 39, 447 [NASA ADS] [CrossRef] [Google Scholar]
- Lubinski, P., Bel, M. G., von Kienlin, A., et al. 2005, ATel, 469, 1 [Google Scholar]
- Lutovinov, A., Rodrigues, J., Budtz-Jorgensen, C., Grebenev, S., & Winkler, C. 2004, ATel, 329, 1 [Google Scholar]
- Lutovinov, A., Revnivtsev, M., Gilfanov, M., et al. 2005, A&A, 444, 821 [NASA ADS] [CrossRef] [EDP Sciences] [Google Scholar]
- Mangano, V., Romano, P., Barthelmy, S. D., et al. 2011, ATel, 3586, 1 [NASA ADS] [Google Scholar]
- Markwardt, C. B., & Krimm, H. A. 2006, ATel, 816, 1 [NASA ADS] [Google Scholar]
- Masetti, N., Bassani, L., Bazzano, A., et al. 2006a, ATel, 815, 1 [NASA ADS] [Google Scholar]
- Masetti, N., Pretorius, M. L., Palazzi, E., et al. 2006b, A&A, 449, 1139 [NASA ADS] [CrossRef] [EDP Sciences] [Google Scholar]
- Mereghetti, S., Sidoli, L., Paizis, A., & Gotz, D. 2006, ATel, 814, 1 [NASA ADS] [Google Scholar]
- Molkov, S., Mowlavi, N., Goldwurm, A., et al. 2003, ATel, 176, 1 [Google Scholar]
- Negoro, H., Morii, M., Kawai, N., et al. 2010, ATel, 3018, 1 [NASA ADS] [Google Scholar]
- Negueruela, I., & Schurch, M. P. E. 2007, A&A, 461, 631 [NASA ADS] [CrossRef] [EDP Sciences] [Google Scholar]
- Negueruela, I., & Smith, D. M. 2006, ATel, 831, 1 [Google Scholar]
- Negueruela, I., Smith, D. M., & Chaty, S. 2005a, ATel, 470, 1 [Google Scholar]
- Negueruela, I., Smith, D. M., & Chaty, S. 2005b, ATel, 429, 1 [Google Scholar]
- Negueruela, I., Smith, D. M., Harrison, T. E., & Torrejón, J. M. 2006a, ApJ, 638, 982 [NASA ADS] [CrossRef] [Google Scholar]
- Negueruela, I., Smith, D. M., Reig, P., Chaty, S., & Torrejón, J. M. 2006b, 604, 165 [Google Scholar]
- Negueruela, I., Smith, D. M., Torrejón, J. M., & Reig, P. 2007, ESA SP, 622, 255 [NASA ADS] [Google Scholar]
- Negueruela, I., Torrejón, J. M., Reig, P., Ribó, M., & Smith, D. M. 2008, 1010, 252 [Google Scholar]
- Nespoli, E., Fabregat, J., & Mennickent, R. E. 2008, A&A, 486, 911 [NASA ADS] [CrossRef] [EDP Sciences] [Google Scholar]
- Oskinova, L. M., Hamann, W.-R., & Feldmeier, A. 2007, A&A, 476, 1331 [NASA ADS] [CrossRef] [EDP Sciences] [Google Scholar]
- Pellizza, L. J., Chaty, S., & Negueruela, I. 2006, A&A, 455, 653 [NASA ADS] [CrossRef] [EDP Sciences] [Google Scholar]
- Press, W. H., & Rybicki, G. B. 1989, ApJ, 338, 277 [NASA ADS] [CrossRef] [Google Scholar]
- Rahoui, F., & Chaty, S. 2008, A&A, 492, 163 [NASA ADS] [CrossRef] [EDP Sciences] [Google Scholar]
- Rahoui, F., Chaty, S., Lagage, P.-O., & Pantin, E. 2008, A&A, 484, 801 [NASA ADS] [CrossRef] [EDP Sciences] [Google Scholar]
- Rampy, R. A., Smith, D. M., & Negueruela, I. 2009, ApJ, 707, 243 [NASA ADS] [CrossRef] [Google Scholar]
- Ratti, E. M., Bassa, C. G., Torres, M. A. P., et al. 2010, MNRAS, 408, 1866 [NASA ADS] [CrossRef] [Google Scholar]
- Rodriguez, J., Garau, A. D., Grebenev, S., et al. 2004, ATel, 340, 1 [Google Scholar]
- Romano, P., Mangano, V., Mereghetti, S., et al. 2007a, ATel, 1151, 1 [NASA ADS] [Google Scholar]
- Romano, P., Sidoli, L., Mangano, V., Mereghetti, S., & Cusumano, G. 2007b, A&A, 469, L5 [NASA ADS] [CrossRef] [EDP Sciences] [Google Scholar]
- Romano, P., Sidoli, L., Mangano, V., et al. 2008, ApJ, 680, L137 [NASA ADS] [CrossRef] [Google Scholar]
- Romano, P., Barthelmy, S., Margutti, R., et al. 2009a, ATel, 2102, 1 [NASA ADS] [Google Scholar]
- Romano, P., Barthelmy, S., Sidoli, L., et al. 2009b, ATel, 2279, 1 [NASA ADS] [Google Scholar]
- Romano, P., Barthelmy, S., Sidoli, L., et al. 2009c, ATel, 2191, 1 [NASA ADS] [Google Scholar]
- Romano, P., Sidoli, L., Cusumano, G., et al. 2009d, MNRAS, 392, 45 [NASA ADS] [CrossRef] [Google Scholar]
- Romano, P., Sidoli, L., Cusumano, G., et al. 2009e, MNRAS, 399, 2021 [NASA ADS] [CrossRef] [Google Scholar]
- Romano, P., Sidoli, L., Cusumano, G., et al. 2009f, ApJ, 696, 2068 [NASA ADS] [CrossRef] [Google Scholar]
- Romano, P., Sidoli, L., Ducci, L., et al. 2010, MNRAS, 401, 1564 [NASA ADS] [CrossRef] [Google Scholar]
- Romano, P., La Parola, V., Vercellone, S., et al. 2011a, MNRAS, 410, 1825 [NASA ADS] [Google Scholar]
- Romano, P., Mangano, V., Cusumano, G., et al. 2011b, MNRAS, 412, L30 [NASA ADS] [Google Scholar]
- Romano, P., Barthelmy, S. D., Chester, M. M., et al. 2012a, ATel, 4095, 1 [NASA ADS] [Google Scholar]
- Romano, P., Mangano, V., Ducci, L., et al. 2012b, MNRAS, 419, 2695 [NASA ADS] [CrossRef] [Google Scholar]
- Romano, P., Mangano, V., Ducci, L., et al. 2013, Adv. Space Res., 52, 1593 [NASA ADS] [CrossRef] [Google Scholar]
- Scargle, J. D. 1982, ApJ, 263, 835 [NASA ADS] [CrossRef] [Google Scholar]
- Sguera, V. 2008, in Proceedings of the 7th INTEGRAL Workshop. 2008 Copenhagen, Denmark. http://pos.sissa.it/cgi-bin/reader/conf.cgi?confid=67, p.82 [Google Scholar]
- Sguera, V., Barlow, E. J., Bird, A. J., et al. 2005, A&A, 444, 221 [NASA ADS] [CrossRef] [EDP Sciences] [Google Scholar]
- Sguera, V., Bazzano, A., Bird, A. J., et al. 2006, ApJ, 646, 452 [NASA ADS] [CrossRef] [Google Scholar]
- Sguera, V., Bird, A. J., Dean, A. J., et al. 2007a, A&A, 462, 695 [NASA ADS] [CrossRef] [EDP Sciences] [Google Scholar]
- Sguera, V., Hill, A. B., Bird, A. J., et al. 2007b, A&A, 467, 249 [NASA ADS] [CrossRef] [EDP Sciences] [Google Scholar]
- Sguera, V., Romero, G. E., Bazzano, A., et al. 2009, ApJ, 697, 1194 [NASA ADS] [CrossRef] [Google Scholar]
- Sidoli, L., Paizis, A., & Mereghetti, S. 2006, A&A, 450, L9 [NASA ADS] [CrossRef] [EDP Sciences] [Google Scholar]
- Sidoli, L., Romano, P., Mereghetti, S., et al. 2007, A&A, 476, 1307 [NASA ADS] [CrossRef] [EDP Sciences] [Google Scholar]
- Sidoli, L., Romano, P., Mangano, V., et al. 2008a, ApJ, 687, 1230 [NASA ADS] [CrossRef] [Google Scholar]
- Sidoli, L., Romano, P., & Vercellone, S. 2008b, ATel, 1444, 1 [NASA ADS] [Google Scholar]
- Sidoli, L., Romano, P., Ducci, L., et al. 2009a, MNRAS, 397, 1528 [NASA ADS] [CrossRef] [Google Scholar]
- Sidoli, L., Romano, P., Esposito, P., et al. 2009b, MNRAS, 400, 258 [NASA ADS] [CrossRef] [Google Scholar]
- Sidoli, L., Romano, P., Mangano, V., et al. 2009c, ApJ, 690, 120 [NASA ADS] [CrossRef] [Google Scholar]
- Smith, D. M., & Heindl, W. A. 2004, ATel, 218, 1 [NASA ADS] [Google Scholar]
- Smith, D. M., Main, D., Marshall, F., et al. 1997, IAU Circ., 6748, 2 [NASA ADS] [Google Scholar]
- Smith, D. M., Main, D., Marshall, F., et al. 1998, ApJ, 501, L181 [NASA ADS] [CrossRef] [Google Scholar]
- Smith, D. M., Negueruela, I., Heindl, W. A., Markwardt, C. B., & Swank, J. H. 2004, in BAAS, 36, 954 [Google Scholar]
- Smith, D. M., Markwardt, C. B., Swank, J. H., & Negueruela, I. 2012, MNRAS, 422, 2661 [NASA ADS] [CrossRef] [Google Scholar]
- Stella, L., White, N. E., & Rosner, R. 1986, ApJ, 308, 669 [NASA ADS] [CrossRef] [Google Scholar]
- Sunyaev, R. A., Grebenev, S. A., Lutovinov, A. A., et al. 2003, ATel, 190, 1 [Google Scholar]
- Swank, J. H., Smith, D. M., & Markwardt, C. B. 2007, ATel, 999, 1 [NASA ADS] [Google Scholar]
- Tomsick, J. A., Lingenfelter, R., Corbel, S., Goldwurm, A., & Kaaret, P. 2004, ATel, 224, 1 [Google Scholar]
- Torrejón, J. M., Negueruela, I., Smith, D. M., & Harrison, T. E. 2010, A&A, 510, A61 [NASA ADS] [CrossRef] [EDP Sciences] [Google Scholar]
- Vijapurkar, J., & Drilling, J. S. 1993, ApJS, 89, 293 [NASA ADS] [CrossRef] [Google Scholar]
- Walborn, N. R. 1973, AJ, 78, 1067 [NASA ADS] [CrossRef] [Google Scholar]
- Walter, R., & Zurita Heras, J. 2007, A&A, 476, 335 [Google Scholar]
- Walter, R., Zurita Heras, J., Bassani, L., et al. 2006, A&A, 453, 133 [NASA ADS] [CrossRef] [EDP Sciences] [Google Scholar]
- Waters, L. B. F. M., de Martino, D., Habets, G. M. H. J., & Taylor, A. R. 1989, A&A, 223, 207 [NASA ADS] [Google Scholar]
- Yamauchi, S., Aoki, T., Hayashida, K., et al. 1995, PASJ, 47, 189 [NASA ADS] [Google Scholar]
- Zurita Heras, J. A., & Chaty, S. 2009, A&A, 493, L1 [NASA ADS] [CrossRef] [EDP Sciences] [Google Scholar]
- Zurita Heras, J. A., & Walter, R. 2004, ATel, 336, 1 [Google Scholar]
- Zurita Heras, J. A., & Walter, R. 2009, A&A, 494, 1013 [NASA ADS] [CrossRef] [EDP Sciences] [Google Scholar]
Appendix A: Supplementary tables
In Tables A.1–A.11, we report the results on individual sources as an abridged list of detections – we selected the brightest flare for each day the source was detected – as marked by an (o) and (d), for orbital-averaged and on-board detection, respectively. The detections from the daily-averaged BATTM light curves are marked by a (D). We also report the subsample of BAT triggers, marked by a (T), along with the trigger number (Col. 6).
BAT detections of IGR J08408−4503.
BAT detections of IGR J16328−4726.
BAT detections of IGR J16418−4532.
BAT detections of IGR J16465−4507.
BAT detections of IGR J16479−4514.
BAT detections of XTE J1739−302.
BAT detections of IGR J17544−2619.
BAT detections of SAX J1818.6−1703.
BAT detections of AX J1841.0−0536.
BAT detections of AX J1845.0−0433.
BAT detections of IGR J18483−0311.
All Tables
Sample of SFXTs: spin, orbital and superorbital periods, and proposed eccentricities.
On-board triggers and detections throughout the Swift mission (2005-02-12 to 2013-05-31).
Expected number of flares in excess of 1.46 × 10⁻⁹ erg cm-2 s-1 (15–150 keV band) for a 5-year mission from the SFXT sample.
All Figures
|
Fig. 1 Example of on-board data: 15–50 keV light curve of IGR J18483−0311. The red points are drawn from 64 s images, the green ones from 320 s images, and the blue ones from other (generally longer) timescale images. |
| In the text | |
|
Fig. 2 Distributions of the flare durations for BAT triggers (T), orbital-averaged BATTM light curves (o), and on-board detections (d) in units of seconds, drawn from the full catalogue. The peaks at 64 and 320 s reach ~270 and 250, respectively. |
| In the text | |
|
Fig. 3 Distributions of the flare fluxes (15–50 keV, in units of mCrab) for BAT triggers (T), daily-averaged BATTM light curves (D), orbital-averaged BATTM light curves (o), and on-board detections (d), which are drawn from the full catalogue. The dotted and dashed histograms represent the on-board detections lasting 320 and 64 s and are responsible for the two peaks in the (d) overall distribution at ~95 and 175 mCrab, respectively. |
| In the text | |
|
Fig. 4 Distributions of the flare fluxes (15–50 keV) for the individual sources for BAT triggers (T), daily-averaged BATTM light curves (D), orbital-averaged BATTM light curves (o), and on-board detections (d) in units of mCrab, drawn from the full catalogue, ordered by right ascension. |
| In the text | |
|
Fig. 5 Top panels: BAT TM light curves (15–50 keV) of the SFXT sample folded at the periods reported in Table 5, ordered by orbital period (reported in the right lower corner of each panel). Bottom panels: BAT on-board detections (d, red histograms) and BATTM orbital detections (o, black histograms) folded at the same periods. The green downward-pointing arrows are the BAT triggers (T). |
| In the text | |
|
Fig. 6 Top panels: flare significance (in units of σ) as a function of orbital phase (periods in Table 5). Green triangles mark the BAT triggers (T), blue diamonds the BATTM daily detections (D), black stars the BATTM orbital detections (o), red crosses the on-board detections (d). Bottom panels: flare flux (in units of mCrab) as a function of orbital phase. The typical relative error on flux is ~15%. |
| In the text | |
|
Fig. 7 Cumulative distributions of σ for BATTM orbital detections (corresponding to (o) in Figs. 5 and 6) for our 100 months of data collected with BAT. We note that 5σ detections for an average orbit correspond to 1.46 × 10⁻⁹ erg cm-2 s-1 in the 15–150 keV band (8.24 × 10⁻¹⁰ erg cm-2 s-1, 15–50 keV). We also note that the typical duration for an average orbit is 800 s for our sample. |
| In the text | |
|
Fig. 8 Left panel: mean absolute deviation of the flare phases as a function of orbital period. Right panel: mean absolute deviation of the flare phases multiplied by the orbital period as a function of orbital period. The dataset is that of orbital detections (o, filled black triangles). The empty triangles are obtained by simulating a population of flares for IGR J16479−4514 and IGR J16418−4532 unaffected by the presence of the eclipse. |
| In the text | |
Current usage metrics show cumulative count of Article Views (full-text article views including HTML views, PDF and ePub downloads, according to the available data) and Abstracts Views on Vision4Press platform.
Data correspond to usage on the plateform after 2015. The current usage metrics is available 48-96 hours after online publication and is updated daily on week days.
Initial download of the metrics may take a while.