Fig. 6
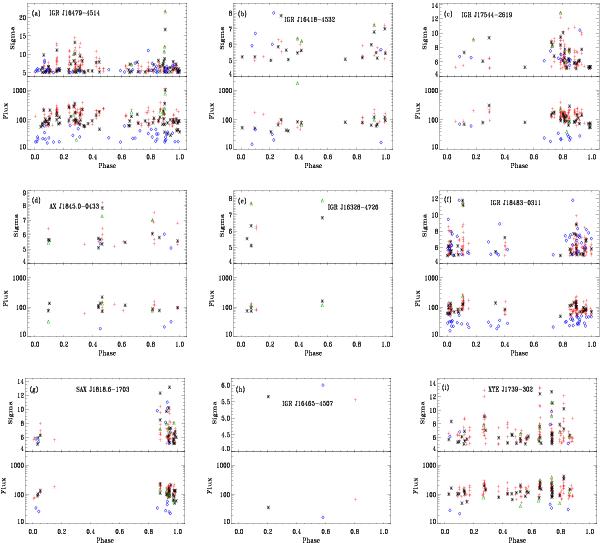
Top panels: flare significance (in units of σ) as a function of orbital phase (periods in Table 5). Green triangles mark the BAT triggers (T), blue diamonds the BATTM daily detections (D), black stars the BATTM orbital detections (o), red crosses the on-board detections (d). Bottom panels: flare flux (in units of mCrab) as a function of orbital phase. The typical relative error on flux is ~15%.
Current usage metrics show cumulative count of Article Views (full-text article views including HTML views, PDF and ePub downloads, according to the available data) and Abstracts Views on Vision4Press platform.
Data correspond to usage on the plateform after 2015. The current usage metrics is available 48-96 hours after online publication and is updated daily on week days.
Initial download of the metrics may take a while.