Free Access
Fig. 2
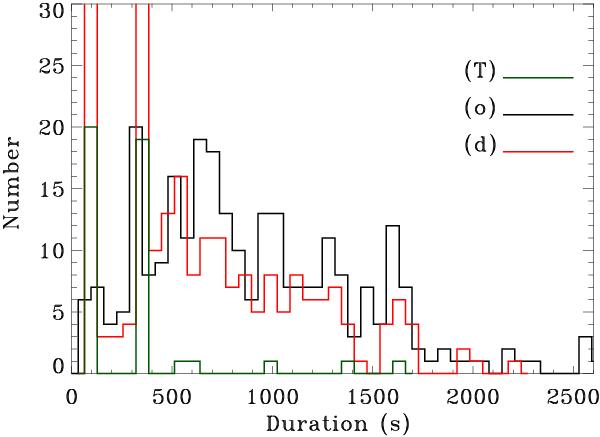
Distributions of the flare durations for BAT triggers (T), orbital-averaged BATTM light curves (o), and on-board detections (d) in units of seconds, drawn from the full catalogue. The peaks at 64 and 320 s reach ~270 and 250, respectively.
Current usage metrics show cumulative count of Article Views (full-text article views including HTML views, PDF and ePub downloads, according to the available data) and Abstracts Views on Vision4Press platform.
Data correspond to usage on the plateform after 2015. The current usage metrics is available 48-96 hours after online publication and is updated daily on week days.
Initial download of the metrics may take a while.