Fig. 8
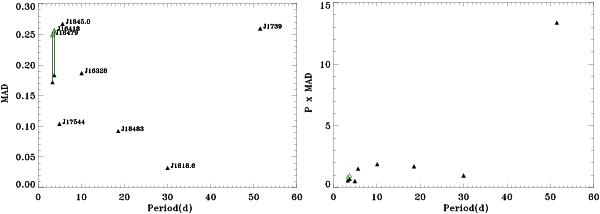
Left panel: mean absolute deviation of the flare phases as a function of orbital period. Right panel: mean absolute deviation of the flare phases multiplied by the orbital period as a function of orbital period. The dataset is that of orbital detections (o, filled black triangles). The empty triangles are obtained by simulating a population of flares for IGR J16479−4514 and IGR J16418−4532 unaffected by the presence of the eclipse.
Current usage metrics show cumulative count of Article Views (full-text article views including HTML views, PDF and ePub downloads, according to the available data) and Abstracts Views on Vision4Press platform.
Data correspond to usage on the plateform after 2015. The current usage metrics is available 48-96 hours after online publication and is updated daily on week days.
Initial download of the metrics may take a while.