Free Access
Fig. 1
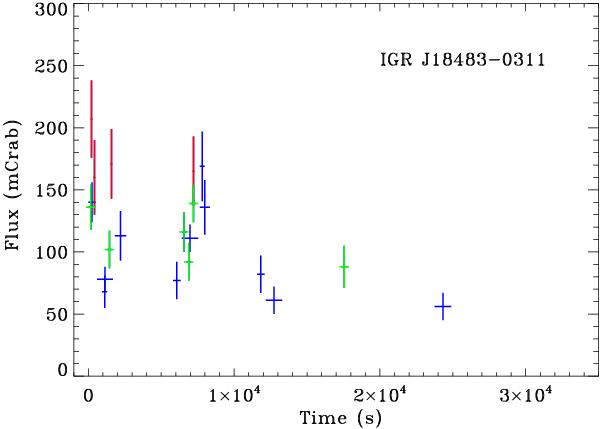
Example of on-board data: 15–50 keV light curve of IGR J18483−0311. The red points are drawn from 64 s images, the green ones from 320 s images, and the blue ones from other (generally longer) timescale images.
Current usage metrics show cumulative count of Article Views (full-text article views including HTML views, PDF and ePub downloads, according to the available data) and Abstracts Views on Vision4Press platform.
Data correspond to usage on the plateform after 2015. The current usage metrics is available 48-96 hours after online publication and is updated daily on week days.
Initial download of the metrics may take a while.