| Issue |
A&A
Volume 562, February 2014
|
|
|---|---|---|
| Article Number | A43 | |
| Number of page(s) | 7 | |
| Section | Cosmology (including clusters of galaxies) | |
| DOI | https://doi.org/10.1051/0004-6361/201321638 | |
| Published online | 05 February 2014 | |
Strong lensing analysis of PLCK G004.5–19.5, a Planck-discovered cluster hosting a radio relic at z = 0.52⋆
1 Leiden Observatory, Leiden University, PO Box 9513, 2300 RA Leiden, The Netherlands
e-mail: This email address is being protected from spambots. You need JavaScript enabled to view it.
2 National Center for Supercomputing Applications, University of Illinois at Urbana-Champaign, 1205 W. Clark St, Urbana IL 61801, USA
3 University of Illinois at Urbana-Champaign, Department of Astronomy, 1002 W. Green Street, Urbana IL 61801, USA
4 Rutgers University, Department of Physics & Astronomy, 136 Frelinghuysen Rd, Piscataway NJ 08854, USA
5 Departamento de Astronomía y Astrofísica, Facultad de Física, Pontificia Universidad Católica de Chile, Casilla 306, 22 Santiago, Chile
6 Zentrum für Astronomie, Institut für Theoretische Astrophysik, Philosophenweg 12, 69120 Heidelberg, Germany
Received: 4 April 2013
Accepted: 5 December 2013
Abstract
Context. The recent discovery of a large number of galaxy clusters using the Sunyaev-Zel’dovich (SZ) effect has opened a new era on the study of the most massive clusters in the Universe. Multiwavelength analyses are required to understand the properties of these new sets of clusters, which are a sensitive probe of cosmology.
Aims. We aim for a multiwavelength characterization of PLCK G004.5−19.5, one of the most massive X-ray validated SZ effect-selected galaxy clusters discovered by the Planck satellite.
Methods. We have observed PLCK G004.5−19.5 with GMOS on the 8.1 m-Gemini South Telescope for optical imaging and spectroscopy, and performed a strong lensing analysis. We also searched for associated radio emission in published catalogs.
Results. An analysis of the optical images confirms that this is a massive cluster, with a dominant central galaxy and an accompanying red sequence of galaxies, plus a 14″-long strong lensing arc. Longslit spectroscopy of six cluster members shows that the cluster is at z = 0.516 ± 0.002. We also targeted the strongly lensed arc, and found zarc = 1.601. We use LensTool to carry out a strong lensing analysis, from which we measure a median Einstein radius θE(zs = 1.6) ≃ 30″ and estimate an enclosed mass ME = 2.45-0.47+0.45 × 10¹⁴ M⊙. By extrapolating a Navarro-Frenk-White profile, we find a total mass M500SL = 4.0-1.0+2.1 × 10¹⁴ M⊙. We also include a constraint on the mass from previous X-ray observations, which yields a slightly higher mass, M500SL+X = 6.7-1.3+2.6 × 10¹⁴ M⊙, consistent with the value from strong lensing alone. Intermediate-resolution radio images from the TIFR GMRT Sky Survey at 150 MHz reveal that PLCK G004.5−19.5 hosts a powerful radio relic on scales ≲500 kpc. Emission at the same location is also detected in low-resolution images at 843 MHz and 1.4 GHz. This is one of the higher redshift radio relics known to date.
Key words: galaxies: clusters: individual: PLCK G004.5-19.5 / gravitational lensing: strong / cosmology: observations
Based on observations obtained at the Gemini Observatory, which is operated by the Association of Universities for Research in Astronomy, Inc., under a cooperative agreement with the National Science Foundation (NSF) on behalf of the Gemini partnership: the NSF (United States), the Science and Technology Facilities Council (United Kingdom), the National Research Council (Canada), Comisión Nacional de Investigación Científica y Tecnológica (CONICYT, Chile), the Australian Research Council (Australia), Ministério da Ciência, Tecnologia e Inovação (Brazil), and Ministerio de Ciencia, Tecnología e Innovación Productiva (Argentina).
Visiting astronomer, Gemini South Observatory.
© ESO, 2014
1. Introduction
In the last few years, the Sunyaev-Zel’dovich (SZ) effect has proven to be an effective method to find massive galaxy clusters at all redshifts, with results from the Atacama Cosmology Telescope (ACT, e.g., Marriage et al. 2011; Hasselfield et al. 2013), the South Pole Telescope (SPT, e.g., Williamson et al. 2011; Reichardt et al. 2013), and the Planck satellite (e.g., Planck Collaboration 2011a, 2014) already yielding a few hundred newly discovered clusters up to z ~ 1.4. The SZ effect is a distortion in the cosmic microwave background (CMB) spectrum in the direction of galaxy clusters caused by inverse Compton scattering of CMB photons by the hot electrons in the intracluster gas (Sunyaev & Zel’dovich 1972). Multiwavelength follow-up observations of SZ-selected clusters have confirmed the unique potential of the SZ effect for detecting the most massive clusters in the Universe (e.g., Benson et al. 2013; Sifón et al. 2013), with the SZ-discovered El Gordo and SPT-CL J2344−4243 being two of the most extreme galaxy clusters ever known (Menanteau et al. 2012; McDonald et al. 2012). As expected, many of these clusters display strong lensing features (Menanteau et al. 2010a), a good indication that these are very massive systems.
Observations of these strongly lensed background galaxies offer one of the most robust ways of constraining the mass of a cluster, providing a direct measure of the mass within the Einstein radius (see Kneib & Natarajan 2011, for a recent review). In combination with other probes (such as X-rays and weak lensing), strong lensing analyses have provided some of the most complete mass distribution models for galaxy clusters, even allowing for the determination of the three-dimensional configuration in some cases (e.g., Morandi et al. 2010; Limousin et al. 2013).
Here, we present a multiwavelength analysis of PLCK G004.5–19.5, one of the most massive, hot and X-ray luminous galaxy clusters discovered by the Planck satellite via the SZ effect and validated with XMM-Newton X-ray observations (Planck Collaboration 2011b). We perform a strong lensing analysis from optical imaging and spectroscopy, and show from archival radio imaging that PLCK G004.5−19.5 hosts a powerful radio relic.
All uncertainties are quoted at the 68.3% (1σ) confidence level. We assume a flat ΛCDM cosmology with ΩM = 0.3 and H0 = 70 km s-1 Mpc-1. Total masses, X-ray, and SZ measurements are reported within a radius r500, which encloses a mean density 500 times the critical density of the Universe at the corresponding redshift. All quantities reported by Planck Collaboration (2011b) (reproduced in Sect. 2.1) have been corrected to the spectroscopic redshift z = 0.516. All magnitudes are in the AB system.
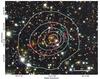 |
Fig. 1 Gemini/GMOS gri pseudo-color image of the central region of PLCK G004.5−19.5. North is up, east is to the left. X-ray surface brightness contours from XMM-Newton are overlaid in white. Spectroscopic cluster members are marked by green circles; only five out of six are visible in the region shown, the sixth member is ~760 kpc to the E-SE of the BCG. Red squares mark the position of the three confirmed multiple images, while we show in red the critical curve for zs = 1.6. The thin cyan box shows the slit used to get the spectrum of the arc (1″ across); the wide cyan box shows the zoomed-in region in the left panel of Fig. 2. The thick white line in the bottom right corner shows a 30″ scale, corresponding to 188 kpc at z = 0.516. |
2. Observations and data analysis
2.1. SZ and X-ray data
The cluster PLCK G004.5−19.5 was discovered through its SZ effect by the Planck satellite. With a signal-to-noise ratio (S/N) of 5.9 in the Early Science release, it is just below the S/N threshold of 6.0 set for the Planck Early SZ sample (Planck Collaboration 2011a)1. Despite this relatively low S/N, it has a strong integrated SZ signal, Y500 = (1.90 ± 0.19) × 10-4 Mpc2, where Y ≡ ∫y dΩ. Here, y is the usual Compton parameter and the integral is over the solid angle of the cluster. We use the Y − M scaling relation of Planck Collaboration (2011c) to estimate a mass  .
.
Subsequent observations of PLCK G004.5−19.5 with XMM-Newton confirmed that it is an extended X-ray source (Planck Collaboration 2011b). Moreover, the observed energy of the Fe K emission line allowed a redshift determination zFe = 0.54, making it the highest redshift cluster of the initial Planck–XMM-Newton validation program. The X-ray analysis of Planck Collaboration (2011b) proves that PLCK G004.5−19.5 is a hot, massive cluster, with an X-ray luminosity2 (in the [0.1−2.4] keV band) of LX = 1.6 × 1045 erg s-1, an integrated temperature kTX = 10.2 ± 0.5 keV, and a gas mass Mgas = 1.3 × 10¹⁴ M⊙. Combined, the latter two give a pseudo-Compton parameter YX ≡ kTXMgas = (13.3 ± 0.9) × 1014M⊙ keV. With this latter value, Planck Collaboration (2011b) estimate a total mass  .
.
2.2. Optical imaging
We observed PLCK G004.5−19.5 on UT 2012 July 19 with the gri filters with GMOS on the Gemini-South Telescope (ObsID:GS-2012A-C-1, PI:Menanteau), with exposure times of 8 × 60 s, 8 × 90 s and 8 × 150 s, respectively; with photometric conditions and seeing ~0 6. Images were coadded using SWarp (Bertin et al. 2002) and photometry was performed using SExtractor (Bertin & Arnouts 1996) in dual mode, using the i-band for detection. Figure 1 shows the combined gri image3 of PLCK G004.5−19.5, which shows clearly that there is an overdensity of red elliptical galaxies with a central dominant brightest cluster galaxy (BCG) close to the X-ray peak. Figure 1 also reveals the presence of several strong lensing features, most notably a giant arc to the west of the BCG, roughly 14″ long.
Each galaxy is assigned a photometric redshift by fitting spectral energy distributions (SEDs) to the gri photometry using the BPZ code (Benítez 2000), including a correction for galactic extinction as described in Menanteau et al. (2010a,b). Typical uncertainties are δz/(1 + z) ≃ 0.09. The photometric redshift of the cluster, zphot = 0.51 ± 0.02, was estimated as in Menanteau et al. (2010a,b) and is consistent with the spectroscopic redshift (Sect. 2.3). We consider as cluster members all galaxies within Δz = 0.03(1 + z0) = 0.045 of z0 = 0.51 and brighter than m⋆ + 2 ≃ 22.9 in the i-band, for a total 222 photometrically-selected members. (Here m⋆ is the characteristic luminosity of the Schechter 1976, function as found by Blanton et al. 2003, passively evolved to z04.) Selecting galaxies from a color–magnitude diagram instead or imposing a brighter membership cut have no influence on the results.
2.3. Optical spectroscopy
Spectroscopically confirmed cluster members.
We performed longslit spectroscopy of PLCK G004.5−19.5 on UT 2012 July 20 with GMOS, with  -wide slits with three pointings, two aimed at confirming cluster members and one targeting the most prominent strongly lensed background galaxy. The data were reduced using PyGMOS5 (Sifón et al. 2013), with an average wavelength calibration root-mean-square (rms) uncertainty of 0.4 Å. Redshifts were measured by cross-correlating the spectra with Sloan Digital Sky Survey (Abazajian et al. 2009) template spectra using the IRAF package RVSAO (Kurtz & Mink 1998). The six confirmed cluster members are listed in Table 1 and are shown in Fig. 1 with green circles. They are all red, passive elliptical galaxies and have a rest-frame velocity dispersion σ ~ 860 km s-1, which is likely not representative of the cluster velocity dispersion. The median redshift of these six members, z = 0.516 ± 0.002, is adopted as the cluster redshift (with uncertainties given by
  ).
).
The left panel of Fig. 2 shows a zoomed-in view of the brightest lensed galaxy. Two brightness peaks can be identified, which we interpret as two blended strong lensing images of a single source (see Sect. 3). The top-right panel shows the 2D spectrum along the arc, where a faint continuum can be distinguished between the north and south images. The red inset histogram shows the normalized counts for each row over the spectral range shown, after an iterative 3σ-clipping rejection so that bad pixels and emission lines are not included in the counts. This histogram shows that the decrease in brightness is significant between the two peaks but that this region is, in turn, still detected at high significance. The middle- and bottom-right panels show the 1D spectra of the two brightness peaks. Both spectra clearly show five redshifted FeII absorption lines with rest-frame wavelengths 2344.2, 2374.5, 2382.8, 2586.6 and 2600.2 Å. The median redshift of these five pairs of lines is zarc = 1.6008 ± 0.0002. The bottom spectrum also shows three emission lines (seen in the 2D spectrum as well), which correspond to Hβ and [OIII]λλ4958, 5007 Å from a foreground compact star-forming galaxy at z = 0.203, for which Hα emission is also observed but not shown in Fig. 2. A small, bright, blue blob is indeed seen overlapping with the south knot (just west of the latter), which we interpret as this foreground galaxy.
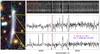 |
Fig. 2 Strong lensing giant arc. The left panel shows a 10″ × 20″ close-up gri image of the arc (cyan box in Fig. 1), with the red crosses marking the location where LensTool predicts the images to be. The thin yellow lines outline the position of the slit and the thick yellow lines mark the approximate locations of the knots from where the 1D spectra are shown. The right panels show the arc spectrum in the wavelength range 5800 Å − 6800 Å. The top right panel shows the GMOS 2D spectrum. The image is 105 pixels, corresponding to |

3. Strong lensing analysis
3.1. Strong lensing model
The strong lensing analysis was performed using the Markov chain Monte Carlo (MCMC) code LensTool (Kneib 1993; Jullo et al. 2007), as follows. The cluster is modeled with an ellipsoidal Navarro-Frenk-White (NFW, Navarro et al. 1995) profile for the main halo, plus a truncated pseudo-isothermal elliptical mass distribution (PIEMD, Kassiola & Kovner 1993; Kneib et al. 1996) with a constant mass-to-light ratio for the 222 brightest cluster members (see Sect. 2.2). A PIEMD halo is modeled by three parameters: the core radius, rcore, the size of the halo (the cut-off radius), rcut, and the velocity dispersion, σ0, which scale with galaxy luminosity as (Jullo et al. 2007):
 (1a)
(1a) (1b)
(1b) (1c)where L⋆ = 6.6 × 10¹⁰ L⊙. The total mass of the galaxy is then given by
  (2)We fix
  kpc, and
  and
and  are free parameters. The center of the NFW halo is fixed to the peak of the X-ray emission (RA = 19:17:04.6, Dec = −33:31:21.9; Planck Collaboration 2011b). Therefore, the mass model has six free parameters: four for the main NFW halo and two for the PIEMD halos.
As can be seen in the red inset histogram of Fig. 2, there is a decrease in brightness in the middle of the arc in between two prominent brightness peaks. We interpret this as the merging of two images of the background galaxy and use this double-imaged arc with zarc = 1.6 as a constraint for the lens model, and identify a third image of the same source to the north-east of the BCG (labeled 1.3 in Fig. 1). The positions and photometry of these three images are listed in Table 2.
The total mass model is therefore optimized using the 222 brightest members (including the six spectroscopic members) and the three images for the background galaxy at z = 1.601. We adopt a positional uncertainty  for the multiple images. The goodness-of-fit for the best model is
  , with an rms error on the image positions of
  . The total mass distribution is moderately elongated along the plane of the sky, approximately aligned with the light distribution. The best-fit values for the six free parameters, plus the posterior masses and radii, are listed in Table 3 (see also Sect. 3.2).
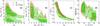 |
Fig. 3 Joint 2D posterior distributions of c200 and M500 (panel a)), ME and M500 (panel b)), c200 and rs (panel c)), and rE and θ (panel d)). Contours are at the 68% and 95% levels. Filled green contours show constraints from strong lensing alone and red contours show the constraints when |

Following Meneghetti et al. (2011), the Einstein radius is estimated as the median distance of the tangential critical curves to the cluster center. We find  , corresponding to a physical distance rE ≃ 190 kpc. Assuming a symmetric lens, the mass inside this region is
  . Integrating the three-dimensional NFW profile for the main halo, we obtain
  . The corresponding radius,
  Mpc, is estimated from M500 assuming a spherical cluster. We note that the values at r500 are an extrapolation of the strong lensing information.
Recently, Zitrin et al. (2012) derived a representative distribution of Einstein radii from a sample of ~10 000 clusters from the SDSS optically-selected sample of Hao et al. (2010). They found a log-normal Einstein radius distribution with mean and standard deviation  for background sources at zs ~ 2. For comparison to Zitrin et al. (2012) and others, we estimate the equivalent Einstein radius to be
  . PLCK G004.5−19.5 is a 2σ outlier from this mean relation; therefore, it can be said to be within the 5% strongest lensing clusters in the Universe.
Images of the strongly lensed galaxy.
Marginalized posterior estimates of the strong lensing model with and without the X-ray mass constraint.
3.2. External constraints
We run LensTool again including a prior in the mass, from the X-ray mass estimated by Planck Collaboration (2011b) as implemented by Verdugo et al. (2011). As mentioned in Sect. 2.1, however, the reported uncertainties are unrealistically small. As a more realistic estimate, we take the intrinsic scatter in the latest YX − M relation by Mahdavi et al. (2013) of 22%, measured by combining weak lensing and X-ray observations. Thus, the additional constraint in the total mass is the following Gaussian prior:  (3)measured at
  kpc6. The same exercise for the SZ mass, assuming an uncertainty of 18% corresponding to the central value of the intrinsic scatter in the YSZ − M measured by Sifón et al. (2013) using dynamical masses and SZ measurements from ACT, gives
  (4)We only use Eq. (3) because both measurements are very similar and because they are both measured at the same radius, determined from the X-ray scaling relation (Planck Collaboration 2011b) and are therefore not independent. The posterior distributions are shown for various combinations of parameters for the two different models in Fig. 3, highlighting degeneracies in the strong lensing model.
The X-ray constraint pushes the mass to a higher value, which is marginally consistent with the strong lensing only (SL) model. Notably, the SL model allows for a low-M500, high-ME (through a high rE), high-concentration and low-ellipticity solution that is marginally excluded by the model including the X-ray constraint (SL+X). The marginalized posterior mass is  . Although the contours are broader in the SL model, the maximum likelihood estimate (MLE) and marginalized 68% range of ME (and rE) are mostly unaffected by the inclusion of the X-ray constraint, with a posterior estimate
  . This is expected, since rE is directly constrained by the strongly lensed images, independent of the mass profile of the cluster.
4. Radio emission
Radio relic.
Radio relics and radio halos are diffuse, non thermal emission features that have no obvious connection with individual cluster galaxies and are often associated with merging activity in massive clusters of galaxies (see Feretti et al. 2012, for a recent review). We searched for such features around PLCK G004.5−19.5 in the 150 MHz images of the TIFR GMRT Sky Survey (TGSS)7 Data Release 5 and in VizieR8 (Ochsenbein et al. 2000) for additional archival data.
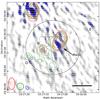 |
Fig. 4 Radio data. Grey scale is a 10′ × 10′ TGSS 150 MHz intensity map around PLCK G004.5−19.5, with contours in blue. Contours are shown at 3, 5, 7, and 15 times σ, where σ is the background rms. Contours are shown in green for NVSS (1.4 GHz) and in red for SUMSS (843 MHz) data. Both contour sets are in units of 3, 5, 10, and 20 times each σ. The orange cross shows the position of the BCG. The dashed black rectangle is the region shown in Fig. 1 and the black circle marks |

Figure 4 shows the intensity map at 150 MHz from the TGSS with blue contours at (3, 5, 7, 15)σ, where σ = 11.9 mJy beam-1 is the background rms level. Green and red contours show 1.4 GHz and 843 MHz emission from the National Radio Astronomical Observatory Very Large Array Sky Survey (NVSS; Condon et al. 1998) and the Sydney University Molonglo Sky Survey (SUMSS; Mauch et al. 2003), respectively. Both sets of contours are shown at (3, 5, 10, 20)σ, where σ = 0.51 mJy beam-1 and 2.0 mJy beam-1 in the NVSS and SUMSS images, respectively. There is significant (>5σ) emission around PLCK G004.5−19.5 in all three frequencies at coincident locations. Moreover, this emission is extended in the TGSS and NVSS images.
We identify a tangentially extended radio relic in the TGSS image, coincident with emission at the other frequencies, although this emission is barely resolved in SUMSS and NVSS (the extent of the emission is roughly two beams in both low-resolution images). The multi frequency properties of this relic are given in Table 4. Radio relics span a wide range of spectral indices, α (where Fν ∝ ν− α), from α ~ 1 up to α ~ 3 (Feretti et al. 2012). We give a preliminary estimate of the integrated spectral index of the relic by fitting a power law to the 150 MHz flux combined with NVSS and SUMSS, one at a time. From both combinations, we measure 0.9 ≲ α ≲ 1.4 at the 68% level. Measuring the spectral index from all three frequencies gives a more shallow, but consistent, spectral index α ~ 0.7 − 1.1, suggesting that the emission at 843 MHz and/or 1.4 GHz may be contaminated by unresolved point sources, thus boosting the flux and lowering α. A spectral index measured using both 843 MHz and 1.4 GHz would be more affected by this contamination since these two frequencies are closer together (in log-space) than any of these frequencies is to the TGSS frequency.
Other sources in the radio images.
We confirm that there are no X-ray point sources associated with any of the radio emission from the XMM-Newton image. As with the relic, sources A, B, C, and E have no counterparts in the optical images, nor in the near infrared (NIR) from the Two Micron All Sky Survey (2MASS, Strutskie et al. 2006) or the mid-infrared (MIR) from the Wide-field Infrared Survey Explorer All Sky Survey (WISE, Wright et al. 2010), within their nominal position uncertainties. Source D has two plausible counterparts from the 2MASS and WISE (merged into one source) catalogs. Both are stars, and are also seen in our optical images. It is, therefore, likely that source D is a radio point source. Given its high flux and shape in the TGSS image, source A is also likely a point source, or two blended point sources.
Because the relic elongation is approximately in the same direction as the TGSS beam and source E, we use source E (which can be regarded as noise-dominated, being much less significant and not detected at any other frequency) as a control for the significance of the relic accounting for the TGSS beam. As seen from Tables 4 and 5, both the relic and source E have similar sizes and position angles. Figure 4 shows, however, that the relic is much more significant than source E. Moreover, the following exercise shows that in the case of source E, the large size is a consequence of the background noise and the beam, whereas the source we associate with the radio relic is significantly extended over the background. We remeasured fluxes for these two sources on images in which we masked all pixels with values below 3σ = 35.7 mJy beam-1. More than half the emission associated with source E comes from pixels with <3σ emission, and the major axis is halved in this masked map. From the relic, in contrast, we still measure ~70% of the total flux, and the major axis is 75% of the size measured in the original map.
5. Discussion and conclusions
We present a multiwavelength analysis of PLCK G004.5−19.5, one of the massive galaxy clusters recently discovered by the Planck satellite using the SZ effect. Optical confirmation from GMOS imaging clearly shows a red sequence of galaxies with a dominant BCG, both undisputable characteristics of galaxy clusters. There is also a strongly lensed giant arc that is composed of two partially merged images of a background galaxy. Spectroscopy of six cluster members plus the giant arc show that the cluster is at z = 0.516 ± 0.002 and that the arc is at zarc = 1.601. With these data, we have performed a strong lensing analysis, confirming a third image for the source producing the arc. We use LensTool to obtain a mass model for the cluster, including the contribution from cluster galaxies, and estimate an Einstein mass , within a median Einstein ring rE ≃ 190 kpc, corresponding to an angular size θE(zs = 1.6) ≃ 30″. Compared to the universal Einstein ring distribution derived by Zitrin et al. (2012), PLCK G004.5−19.5 is among the 5% strongest gravitational lenses in the Universe. By integrating the three-dimensional NFW profile, we estimate . We also run LensTool including a Gaussian prior for the X-ray mass estimated by Planck Collaboration (2011b) and find , marginally consistent with the mass estimated from strong lensing alone. The Einstein mass does not change significantly when including the X-ray constraint because the latter is constrained directly by the strongly lensed galaxy. The inclusion of the X-ray mass constraint does help to exclude a high-mass, low-concentration solution, which is allowed by the strong lensing-only model.
Examination of archival intermediate-resolution radio data from the TIFR GMRT Sky Survey at 150 MHz reveals the presence of a radio relic at approximately 250 kpc from the cluster center. Significant emission is also detected in low-resolution images from NVSS at 1.4 GHz and SUMSS at 843 MHz. A preliminary measurement of the integrated spectral index yields α ~ 0.9 − 1.4. We find no detectable point sources contributing significantly to the radio emission in the XMM-Newton or Gemini images, nor from archival observations in the NIR or MIR. This radio emission likely originated from recent merging activity, but the available data do not allow for a detailed study of possible merging events. The origin of the radio emission will be addressed with future observations.
PLCK G004.5−19.5 has been included in the new Planck SZ catalog (Planck Collaboration 2014) with a S/N of 6.15.
The uncertainties in the X-ray values from Planck Collaboration (2011b) do not include systematic errors and have been dropped when negligible.
Created with stiff (Bertin 2012).
For reference, the BCG has a luminosity L = 9.5 L⋆.
Note that in LensTool the X-ray constraint to the strong lensing model is given as a fixed mass M at a fixed radius r (with a mass uncertainty), not explicitly as the mass at a given overdensity.
Acknowledgments
We thank Timo Anguita for help with the arc spectrum. C.S. acknowledges support from the European Research Council under FP7 grant number 279396 awarded to H. Hoekstra. C.S. and L.F.B. have been supported by “Centro de Astrofísica FONDAP” 15010003, Centro BASAL-CATA, by FONDECYT under project 1120676 and by ALMA-CONICYT under projects 31090002 and 31100003. J.P.H. acknowledges support from NASA ADAP grant number NNX11AJ48G. This research has made use of the VizieR catalogue access tool, CDS, Strasbourg, France. The original description of the VizieR service was published in A&AS 143, 23. This research work used the TIFR GMRT Sky Survey (http://tgss.ncra.tifr.res.in) data products. We thank the staff of the GMRT who have made these observations possible. GMRT is run by the National Centre for Radio Astrophysics of the Tata Institute of Fundamental Research. All plots in this paper were generated with the python package matplotlib (Hunter 2007).
References
- Abazajian, K. N., Adelman-McCarthy, J. K., Agüeros, M. A., et al. 2009, ApJ, 182, 543 [Google Scholar]
- Benítez, N. 2000, ApJ, 536, 571 [NASA ADS] [CrossRef] [Google Scholar]
- Benson, B. A., de Haan, T., Dudley, J. P., et al. 2013, ApJ, 763, 147 [NASA ADS] [CrossRef] [Google Scholar]
- Bertin, E. 2012, ASPC, 461, 263 [Google Scholar]
- Bertin, E., & Arnouts, S. 1996, A&AS, 317, 393 [NASA ADS] [CrossRef] [EDP Sciences] [Google Scholar]
- Bertin, E., Mellier, Y., Radovich, M., et al. 2002, ASPC, 281, 228 [Google Scholar]
- Blanton, M. R., Hogg, D. W., Bahcall, N. A., et al. 2003, ApJ, 592, 819 [NASA ADS] [CrossRef] [Google Scholar]
- Condon, J. J., Cotton, W. D., Greisen, E. W., et al. 1998, AJ, 115, 1693 [NASA ADS] [CrossRef] [Google Scholar]
- Feretti, L., Giovannini, G, Govoni, F., & Murgia, M. 2012, A&ARv, 20, 54 [Google Scholar]
- Hao, J., McKay, T. A., Koester, B. P., et al. 2010, ApJS, 191, 254 [NASA ADS] [CrossRef] [Google Scholar]
- Hasselfield, M., Hilton, M., Marriage, T. A., et al. 2013, JCAP, 1307, 008 [Google Scholar]
- Hunter, J. D. 2007, Comput. Sci. Eng., 9, 90 [Google Scholar]
- Jullo, E., Kneib, J.-P., Limousin, M., et al. 2007, New J. Phys., 9, 447 [Google Scholar]
- Kassiola, A., & Kovner, I. 1993, ApJ, 417, 450 [NASA ADS] [CrossRef] [Google Scholar]
- Kneib, J.-P. 1993, Ph.D. Thesis, Univ. Paul Sabatier, Toulouse, France [Google Scholar]
- Kneib, J.-P., & Natarajan, P. 2011, ARA&A, 19, 47 [Google Scholar]
- Kneib, J.-P., Ellis, R. S., Smail, I., Couch, W. J., & Sharples, R M. 1996, ApJ, 471, 643 [NASA ADS] [CrossRef] [Google Scholar]
- Kurtz, M. J., & Mink, D. J. 1998, PASP, 110, 934 [NASA ADS] [CrossRef] [Google Scholar]
- Limousin, M., Morandi, A., Sereno, M., et al. 2013, Space Sci. Rev., 177, 155 [NASA ADS] [CrossRef] [Google Scholar]
- Mahdavi, A., Hoekstra, H., Babul, A., et al. 2013, ApJ, 767, 116 [NASA ADS] [CrossRef] [Google Scholar]
- Marriage, T. A., Acquaviva, V., Ade, P. A. R., et al. 2011, ApJ, 737, 61 [NASA ADS] [CrossRef] [Google Scholar]
- Mauch, T., Murphy, T., Buttery, H. J., et al. 2003, MNRAS, 342, 1117 [NASA ADS] [CrossRef] [Google Scholar]
- McDonald, M., Bayliss, M., Benson, B. A., et al. 2012, Nature, 488, 349 [NASA ADS] [CrossRef] [Google Scholar]
- Menanteau, F., González, J., Juin, J.-B., et al. 2010a, ApJ, 723, 1523 [NASA ADS] [CrossRef] [Google Scholar]
- Menanteau, F., Hughes, J. P., Barrientos, L. F., et al. 2010b, ApJS, 191, 340 [NASA ADS] [CrossRef] [Google Scholar]
- Menanteau, F., Hughes, J. P., Sifón, C., et al. 2012, ApJ, 748, 7 [NASA ADS] [CrossRef] [Google Scholar]
- Meneghetti, M., Fedeli, C., Zitrin, A., et al. 2011, A&A, 530, A17 [CrossRef] [EDP Sciences] [Google Scholar]
- Morandi, A., Pedersen, K., & Limousin, M. 2010, ApJ, 713, 491 [NASA ADS] [CrossRef] [Google Scholar]
- Navarro, J. F., Frenk, C. S., & White, S. D. M. 1995, MNRAS, 275, 56 [Google Scholar]
- Ochsenbein, F., Bauer, P., & Marcout, J. 2000, A&AS, 143, 23 [NASA ADS] [CrossRef] [EDP Sciences] [Google Scholar]
- Planck Collaboration 2011a, A&A, 536, A8 [NASA ADS] [CrossRef] [EDP Sciences] [Google Scholar]
- Planck Collaboration 2011b, A&A, 536, A9 [NASA ADS] [CrossRef] [EDP Sciences] [Google Scholar]
- Planck Collaboration 2011c, A&A, 536, A11 [NASA ADS] [CrossRef] [EDP Sciences] [Google Scholar]
- Planck Collaboration 2014, A&A, submitted [arXiv:1303.5089] [Google Scholar]
- Reichardt, C. L., Stalder, B., Bleem, L. E., et al. 2013, ApJ, 763, 127 [NASA ADS] [CrossRef] [Google Scholar]
- Schechter, P. L. 1976, ApJ, 203, 297 [Google Scholar]
- Sifón, C., Menanteau, F., Hasselfield, M., et al. 2013, ApJ, 772, 25 [NASA ADS] [CrossRef] [Google Scholar]
- Strutskie, M. F., Cutri, R. M., Stiening, R., et al. 2006, AJ, 131, 1163 [NASA ADS] [CrossRef] [Google Scholar]
- Sunyaev, R. A., & Zel’dovich, Y. B. 1972, Comm. Astrophys. Space Phys., 4, 173 [Google Scholar]
- Verdugo, T., Motta, V., Muñoz, R. P., et al. 2011, A&A, 527, A124 [NASA ADS] [CrossRef] [EDP Sciences] [Google Scholar]
- Williamson, R., Benson, B. A., High, F. W., et al. 2011, ApJ, 738, 139 [NASA ADS] [CrossRef] [Google Scholar]
- Wright, E. L., Eisenhardt, P. R. M., Mainzer, A. K., et al. 2010, AJ, 140, 1868 [NASA ADS] [CrossRef] [Google Scholar]
- Zitrin, A., Broadhurst, T., Bartelmann, M., et al. 2012, MNRAS, 423, 2308 [NASA ADS] [CrossRef] [Google Scholar]
All Tables
Marginalized posterior estimates of the strong lensing model with and without the X-ray mass constraint.
All Figures
|
Fig. 1 Gemini/GMOS gri pseudo-color image of the central region of PLCK G004.5−19.5. North is up, east is to the left. X-ray surface brightness contours from XMM-Newton are overlaid in white. Spectroscopic cluster members are marked by green circles; only five out of six are visible in the region shown, the sixth member is ~760 kpc to the E-SE of the BCG. Red squares mark the position of the three confirmed multiple images, while we show in red the critical curve for zs = 1.6. The thin cyan box shows the slit used to get the spectrum of the arc (1″ across); the wide cyan box shows the zoomed-in region in the left panel of Fig. 2. The thick white line in the bottom right corner shows a 30″ scale, corresponding to 188 kpc at z = 0.516. |
| In the text | |
|
Fig. 2 Strong lensing giant arc. The left panel shows a 10″ × 20″ close-up gri image of the arc (cyan box in Fig. 1), with the red crosses marking the location where LensTool predicts the images to be. The thin yellow lines outline the position of the slit and the thick yellow lines mark the approximate locations of the knots from where the 1D spectra are shown. The right panels show the arc spectrum in the wavelength range 5800 Å − 6800 Å. The top right panel shows the GMOS 2D spectrum. The image is 105 pixels, corresponding to |
| In the text | |
|
Fig. 3 Joint 2D posterior distributions of c200 and M500 (panel a)), ME and M500 (panel b)), c200 and rs (panel c)), and rE and θ (panel d)). Contours are at the 68% and 95% levels. Filled green contours show constraints from strong lensing alone and red contours show the constraints when |
| In the text | |
|
Fig. 4 Radio data. Grey scale is a 10′ × 10′ TGSS 150 MHz intensity map around PLCK G004.5−19.5, with contours in blue. Contours are shown at 3, 5, 7, and 15 times σ, where σ is the background rms. Contours are shown in green for NVSS (1.4 GHz) and in red for SUMSS (843 MHz) data. Both contour sets are in units of 3, 5, 10, and 20 times each σ. The orange cross shows the position of the BCG. The dashed black rectangle is the region shown in Fig. 1 and the black circle marks |
| In the text | |
Current usage metrics show cumulative count of Article Views (full-text article views including HTML views, PDF and ePub downloads, according to the available data) and Abstracts Views on Vision4Press platform.
Data correspond to usage on the plateform after 2015. The current usage metrics is available 48-96 hours after online publication and is updated daily on week days.
Initial download of the metrics may take a while.