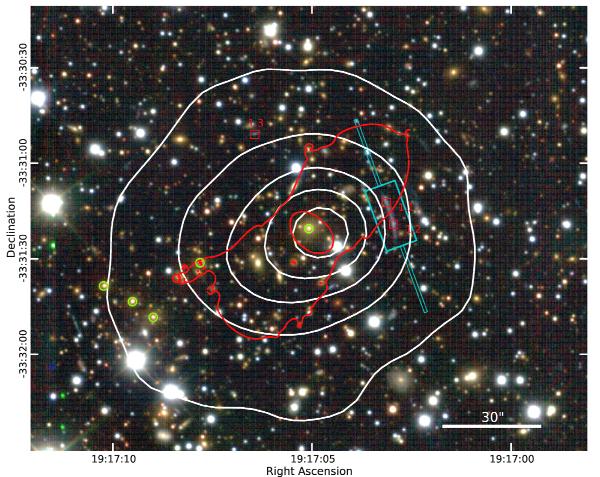
Fig. 1

Gemini/GMOS gri pseudo-color image of the central region of PLCK G004.5−19.5. North is up, east is to the left. X-ray surface brightness contours from XMM-Newton are overlaid in white. Spectroscopic cluster members are marked by green circles; only five out of six are visible in the region shown, the sixth member is ~760 kpc to the E-SE of the BCG. Red squares mark the position of the three confirmed multiple images, while we show in red the critical curve for zs = 1.6. The thin cyan box shows the slit used to get the spectrum of the arc (1″ across); the wide cyan box shows the zoomed-in region in the left panel of Fig. 2. The thick white line in the bottom right corner shows a 30″ scale, corresponding to 188 kpc at z = 0.516.
Current usage metrics show cumulative count of Article Views (full-text article views including HTML views, PDF and ePub downloads, according to the available data) and Abstracts Views on Vision4Press platform.
Data correspond to usage on the plateform after 2015. The current usage metrics is available 48-96 hours after online publication and is updated daily on week days.
Initial download of the metrics may take a while.


