Fig. 4
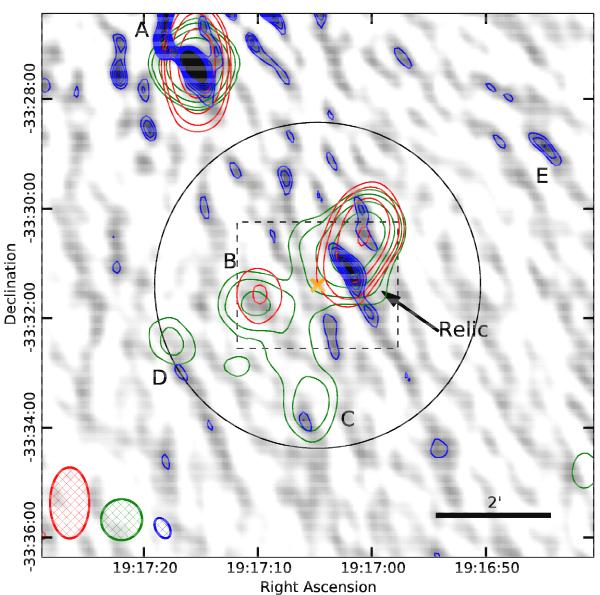
Radio data. Grey scale is a 10′ × 10′ TGSS 150 MHz intensity map around PLCK G004.5−19.5, with contours in blue. Contours are shown at 3, 5, 7, and 15 times σ, where σ is the background rms. Contours are shown in green for NVSS (1.4 GHz) and in red for SUMSS (843 MHz) data. Both contour sets are in units of 3, 5, 10, and 20 times each σ. The orange cross shows the position of the BCG. The dashed black rectangle is the region shown in Fig. 1 and the black circle marks  Mpc. The black bar in the bottom right corner marks a scale of 2′. The SUMSS, NVSS, and TGSS beams are shown from left to right, respectively, in the bottom left corner (hatched ellipses).
Current usage metrics show cumulative count of Article Views (full-text article views including HTML views, PDF and ePub downloads, according to the available data) and Abstracts Views on Vision4Press platform.
Data correspond to usage on the plateform after 2015. The current usage metrics is available 48-96 hours after online publication and is updated daily on week days.
Initial download of the metrics may take a while.