Fig. 2
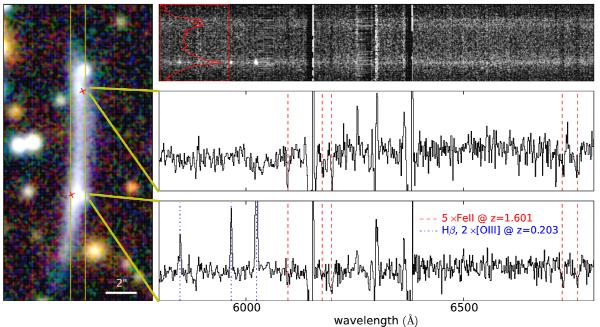
Strong lensing giant arc. The left panel shows a 10″ × 20″ close-up gri image of the arc (cyan box in Fig. 1), with the red crosses marking the location where LensTool predicts the images to be. The thin yellow lines outline the position of the slit and the thick yellow lines mark the approximate locations of the knots from where the 1D spectra are shown. The right panels show the arc spectrum in the wavelength range 5800 Å − 6800 Å. The top right panel shows the GMOS 2D spectrum. The image is 105 pixels, corresponding to  , from top to bottom. The red histogram (inset) shows the total counts in each row over the spectral range shown, after an iterative 3σ-clipping to remove bad pixels and emission lines. This highlights the decrease in brightness (and the significance of the continuum) between the two images. The middle and bottom panels show, respectively, the 1D spectra of the northern (source 1.1) and southern (source 1.2) peaks seen in the lensed arc, each marked by a yellow “wedge” in the left panel. In these, the dashed red lines mark the five FeII absorption lines at z = 1.601 and the dash-dotted blue lines mark the emission lines from a foreground galaxy at z = 0.203, only seen in the south spectrum. The vertical axes in these two panels are in arbitrary units.
Current usage metrics show cumulative count of Article Views (full-text article views including HTML views, PDF and ePub downloads, according to the available data) and Abstracts Views on Vision4Press platform.
Data correspond to usage on the plateform after 2015. The current usage metrics is available 48-96 hours after online publication and is updated daily on week days.
Initial download of the metrics may take a while.