Fig. 3
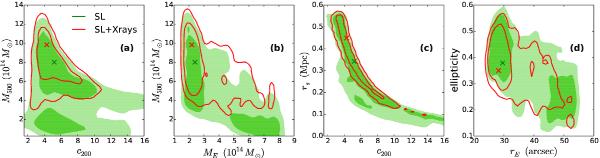
Joint 2D posterior distributions of c200 and M500 (panel a)), ME and M500 (panel b)), c200 and rs (panel c)), and rE and θ (panel d)). Contours are at the 68% and 95% levels. Filled green contours show constraints from strong lensing alone and red contours show the constraints when  is included as an independent constraint. Crosses show the corresponding maximum likelihood estimates.
Current usage metrics show cumulative count of Article Views (full-text article views including HTML views, PDF and ePub downloads, according to the available data) and Abstracts Views on Vision4Press platform.
Data correspond to usage on the plateform after 2015. The current usage metrics is available 48-96 hours after online publication and is updated daily on week days.
Initial download of the metrics may take a while.