| Issue |
A&A
Volume 561, January 2014
|
|
|---|---|---|
| Article Number | A69 | |
| Number of page(s) | 6 | |
| Section | Interstellar and circumstellar matter | |
| DOI | https://doi.org/10.1051/0004-6361/201322638 | |
| Published online | 03 January 2014 | |
Kinematics of the ionized-to-neutral interfaces in Monoceros R2⋆
1 Los Alamos National Laboratory, PO Box 1663, Los Alamos ( NM ) 87545, USA
e-mail: This email address is being protected from spambots. You need JavaScript enabled to view it.
2 Observatorio Astronómico Nacional, Apdo. 112, 28803 Alcalá de Henares ( Madrid), Spain
3 Centro de Astrobiología, (INTA-CSIC), Ctra. M-108, km. 4, 28850 Torrejón de Ardoz, Spain
4 LERMA, Observatoire de Paris, 61 Av. de l’Observatoire, 75014 Paris, France
5 I. Physikalisches Institut der Universität zu Köln, Zülpicher Straße 77, 50937 Köln, Germany
6 Université de Toulouse, UPS, IRAP, 9 Avenue du colonel Roche, 31062 Toulouse Cedex 4, France
7 CNRS, UMR 5187, 31028 Toulouse, France
8 Instituto de Radio Astronomía Milimétrica (IRAM), Avenida Divina Pastora 7, Local 20, 18012 Granada, Spain
9 Osservatorio Astrofisico di Arcetri, INAF, Largo E. Fermi 5, 50125 Firenze, Italy
10 Institut de Radioastronomie Millimétrique, 300 Rue de la Piscine, 38406 Saint Martin d’Héres, France
Received: 9 September 2013
Accepted: 31 October 2013
Abstract
Context. Monoceros R2 (Mon R2), at a distance of 830 pc, is the only ultra-compact H ii region (UC H ii) where its associated photon-dominated region (PDR) can be resolved with the Herschel Space Observatory.
Aims. Our aim is to investigate observationally the kinematical patterns in the interface regions (i.e., the transition from atomic to molecular gas) associated with Mon R2.
Methods. We used the HIFI instrument on board Herschel to observe the line profiles of the reactive ions CH+, OH+, and H2O+ toward different positions in Mon R2. We derive the column density of these molecules and compare them with gas-phase chemistry models.
Results. The reactive ion CH+ is detected both in emission (at central and red-shifted velocities) and in absorption (at blue-shifted velocities). The OH+ ion is detected in absorption at both blue- and red-shifted velocities, with similar column densities; H2O+ is not detected at any of the positions, down to a rms of 40 mK toward the molecular peak. At this position, we find that the OH+ absorption originates in a mainly atomic medium, and therefore is associated with the most exposed layers of the PDR. These results are consistent with the predictions from photo-chemical models. The line profiles are consistent with the atomic gas being entrained in the ionized gas flow along the walls of the cavity of the H ii region. Based on this evidence, we are able to propose a new geometrical model for this region.
Conclusions. The kinematical patterns of the OH+ and CH+ absorption indicate the existence of a layer of mainly atomic gas for which we have derived, for the first time, some physical parameters and its dynamics.
Key words: ISM: abundances / ISM: molecules / ISM: individual objects: Monoceros R2 / photon-dominated region (PDR) / HII regions
Herschel is an ESA space observatory with science instruments provided by European-led Principal Investigator consortia and with important participation from NASA.
© ESO, 2014
1. Introduction
Monoceros R2 (Mon R2) is a relatively close (830 pc) ultra-compact H ii region (UCH ii). Because of its brightness and proximity, it is the best source in which to investigate the chemistry and physics of this stage of high-mass stellar formation. The main ionizing source, IRS1, is located at the center of a spherical cavity free of molecular gas which extends for about 20′′ (0.08 pc) in radius (Choi et al. 2000). The UCH ii is surrounded by several photon-dominated regions (PDRs) that are characterized by different physical and chemical conditions (Rizzo et al. 2003; Berné et al. 2009; Pilleri et al. 2013). These PDRs have a roughly circular spatial distribution, with a projected thickness between 4′′ and 6′′ (~0.02 pc, Berné et al. 2009). Rizzo et al. (2003) estimated the intensity of the UV radiation field to be G0 ~ 5 × 10⁵ in units of the Habing (1968) field, by fitting the observed far-IR intensity with a blackbody curve, assuming an effective temperature of Teff = 25 000 K and using the projected radius of the H ii region as the real distance from the star. Berné et al. (2009) studied the H2 mid-IR lines from Spitzer-IRS observations and estimated a hydrogen density in the PDRs ranging from nH = 4 × 103 cm-3 to 4 × 105 cm-3. Higher densities, up to nH = 6 × 106 cm-3, were found by Choi et al. (2000); Rizzo et al. (2003); and Pilleri et al. (2013) to account for the emission of molecular species in the far-IR and radio domains. The UCH ii and the PDRs are surrounded by a moderate density (nH2 ~ 5 × 104 cm-3), cometary-shaped molecular cloud (Fuente et al. 2010; Pilleri et al. 2012, 2013).
Observed noise and continuum brightness, in Tmb.
Observations and modeling of this source showed that the molecular cloud is relatively quiescent, with the systemic velocity of the main cloud being ~11 km s-1and expansion velocities ≲1 km s-1 (Fuente et al. 2010; Pilleri et al. 2012). High velocity wings, observed at red-shifted velocities relative to the cloud systemic velocity, can be attributed either to the expansion of the PDR surrounding the H ii region or to the relic of a now inactive outflow (Giannakopoulou et al. 1997; Pilleri et al. 2012, 2013). Jaffe et al. (2003), through the analysis of high spatial and spectral resolution observations of the 12.8 μm Ne ii line, suggested that the innermost H ii region is expanding at a high velocity vexp = 10 km s-1. Zhu et al. (2005) refined this scenario, showing that these patterns are more satisfactorily explained by a model in which the cavity is devoid of gas and dust and is maintained by stellar wind pressure. In this interpretation, the central H ii region is not expanding, but the ionized gas runs along the walls of the surrounding cloud, a behavior also found in other UCH ii regions (Zhu et al. 2008). Finally, the overall Mon R2 complex seems to undergo a slow rotation (Loren 1977; Pilleri et al. 2012).
Our previous observations of the molecular gas in Mon R2 (Pilleri et al. 2012) put a strong upper limit to the expansion velocity of the innermost layers of this region, in agreement with the interpretation of Zhu et al. (2005). We have obtained new high spectral resolution observations with Herschel that provide new insights into the geometry and kinematics of the intermediate atomic layers between the H ii gas and the fully molecular gas. Herschel allows us to detect reactive ions such as OH+, H2O+, and CH+ that trace the first steps of the chemistry in UV-illuminated gas. In particular, the Heterodyne Instrument for the Far Infrared (HIFI, de Graauw et al. 2010) allows us to resolve the line profiles and constrain the kinematics of the gas where the atomic/ionized to molecular/neutral gas transition takes place. In Sect. 2 we present our observations, and the results are reported in Sect. 3. Sections 4 and 5 present the discussion and conclusions.
2. Observations
The observations presented here were obtained as part of two programs of the Herschel Space Observatory (Pilbratt et al. 2010): the WADI key program (Ossenkopf et al. 2011), and a follow-up open-time program (PI: P. Pilleri). We observed the CH+ (1−0, 835 GHz), OH+ (N = 1−0, J = 2−1, 971 GHz), and H2O+ (111 − 000, 1115 GHz) transitions using HIFI to resolve the kinematics of these lines. We also obtained a 2′ × 2′ HIFI on-the-fly (OTF) map of the [C ii]  line at 1900.5 GHz. The half-power beam width (HPBW) of Herschel at these frequencies is 25′′, 22′′, 19′′, and 11′′ for the CH+, OH+, H2O+, and [C ii] lines, respectively.
In this paper, we present data taken at three different positions (Fig. 1): the ionization front (IF: RAJ2000 = 06h07m46.2s, DecJ2000 = −06°23′08.3′′), the molecular peak 1 (MP1) at offset [+10′′, − 10′′] relative to the IF, and continuum point 1 (CP1) at offset [− 28′′, 10′′]. The first two points have been studied in detail in several molecular and atomic lines (e.g., Rizzo et al. 2003; Fuente et al. 2010; Pilleri et al. 2012, 2013; Ginard et al. 2012; Ossenkopf et al. 2013) and are key references for this source. The last point (CP1) was chosen to be as far as possible from the IF position and still have a significant continuum at the observed frequencies.
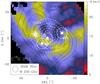 |
Fig. 1 In color, the C18O 2−1 integrated intensity in the range [5−15] km s-1 (Pilleri et al. 2012). Squares indicate the positions of the OH+ 1−0 (971 GHz) observations, and the white circles show the HPBW of Herschel at this frequency. White dashed contours show the H(42α) integrated intensity from 1 to 11 K km s-1 in linear steps of 2 K km s-1. Black contours represent the relative variation of the continuum emission at 971 GHz from SPIRE-FTS in 20% intervals of the peak, 0.6 K. |
Observational results.
The OH+ line at all positions and the H2O+ line toward MP1 were observed using single pointing, double beam switch pattern, also providing a reliable measurement of the 971 GHz continuum at all positions and at 1113 GHz toward MP1. The CH+ observation toward the IF was observed in WADI with a high signal-to-noise ratio (S/N) on a strip centered toward the IF, that also provides a good estimate of the continuum at 835 GHz at this position. The remaining CH+ and H2O+ observations were obtained from a full 2′ × 2′ OTF map centered at the IF. Unfortunately, using OTF on such large areas causes large drifts in the continuum level. To estimate the continuum for these observations, we assume that the relative ratios of the continuum are the same at all positions, and scale the 971 GHz continuum (which is measured at all positions) accordingly. We also use the sparse-sampling continuum map at 971 GHz obtained with SPIRE-FTS within the program SPECHIS-GT (PI: E. Polehampton).
The data were pipelined using HIPE (Ott 2010) 9.0 and then Level 2 products were exported to FITS format. Further analysis was performed with the CLASS/GILDAS suite (Pety 2005), and consisted of averaging the two polarizations and conversion to main beam temperature (Tmb) scale. Finally, we divided the observed continuum by 2 since HIFI is a double side band receiver with a sideband ratio of ~1 (Roelfsema et al. 2012) at these frequencies.
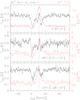 |
Fig. 2 Observed spectra of the CH+ (red) and OH+ (black) lines at different positions: the ionization front (IF), the molecular peak 1 (MP1), and the continuum point CP1. The continuum levels have been divided by two to correct for the DSB observations. Vertical dashed lines show the transition velocities, assuming a bulk velocity of the cloud of 11 km s-1. |
3. Results
Figure 2 displays the detected lines toward the IF, MP1, and CP1. The H2O+ ion was not detected toward any position (see Table 2 for the detection limits). This provides strong limits on the gas molecular fraction (Hollenbach et al. 2012). The OH+ ion is detected in absorption at all positions, with two broad features peaking at blue-shifted (Δv ~ −8 km s-1) and red-shifted (Δv ~ 4 km s-1) velocities relative to 11 km s-1, the bulk velocity of the cloud. The CH+ ion is observed in emission in the interval [5,20] km s-1. Toward IF and MP1, and tentatively toward CP1, it presents an absorption feature at blue-shifted velocities ([− 5,5] km s-1).
In Fig. 3, we show the integrated intensity maps of the CH+ and [C ii] lines obtained from our OTF mapping observations in different velocity bins. The red-shifted emission is clearly related to the H ii region and to the surrounding PDRs, whereas the blue-shifted absorption better correlates with the C18O 2−1 emission, as well as the 971 GHz continuum emission (shown in Fig. 1) tracing the bulk of the dust emission associated with the molecular cloud. The central velocities [5, 12] km s-1 seem to be associated with the H ii region and the northern, low-UV irradiated PDR described in Ginard et al. (2012) and Pilleri et al. (2013).
In the following, we focus on the blue- and red-shifted velocities. We define the blue and red intervals as [−5,5] km s-1 and [12,20] km s-1, respectively. In Table 2 we present a summary of the observational results, detailed below.
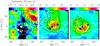 |
Fig. 3 Integrated intensity of the blue ([–5, 5] km s-1), central ([5,12] km s-1), and red ([12, 20] km s-1) intervals of the CH+ 1−0 (color scale) and [C ii] lines (black contours, starting at 15 K km s-1 with a step of 5 K km s-1 for the blue interval, starting at 50 K km s-1 with a step of 50 K km s-1 for the central and red intervals). White contours are the integrated intensity between 5 and 15 km s-1 of the C18O 2−1 line. In the blue interval, the CH+ absorption (dark color) correlates with the molecular cloud. |
CH+.
Owing to very high critical densities, the CH+ level population is out of local thermodynamic equilibrium, thus the column density of the gas associated with the emission line depends on the assumed excitation temperature (Tex). As a first approximation, we used the MADEX large velocity gradient (LVG) code (Cernicharo 2012) assuming the typical physical conditions of the PDR (nH2 ~ 2 × 105 cm-3, Tkin ~ 100 K; Pilleri et al. 2012) to estimate the column density of this molecule at all positions, since the bulk of the CH+ emission is expected to come from the most exposed layers (AV ≲ 1) of the PDR (Nagy et al. 2013). To fit the observed intensity of the J = 1 − 0 line toward the IF position, the LVG code gives Tex ~ 10 K, an opacity of τ = 3.2, and a total column density of 7.4 × 1013 cm-2 for the red-shifted velocity interval. At the other extreme, if we consider that the emission comes from the densest layer (nH2 = 3 × 106 cm-3, Rizzo et al. 2003; Pilleri et al. 2012), we obtain Tex = 14 K and N(CH+) = 6 × 1012 cm-2, corresponding to an opacity of 0.2.
The column density in the blue interval can be calculated with the usual steps for absorption measurements. We calculated the opacity of the absorption at each velocity as τ = −log (Tl/Tc) where Tl and Tc are the line and continuum intensities, respectively. This can be used to estimate the molecular column density using N(CH+) = 3.1 × 10¹²∫τdv cm-2 (Godard et al. 2012). In the expression above, we have assumed that the absorbing CH+ gas is almost entirely in its ground rotational state (Tex < 5 K), which is justified by the relatively large Einstein Aul coefficient for this transition, implying a large critical density (>106 cm-3). We also assume that the covering factor over the continuum source is unity. This is reasonable according to the SPIRE map (Fig. 1), although we cannot exclude some clumpiness at smaller scales.
OH+
We calculated the integrated opacities ∫τdv of the OH+ line in the different velocity intervals (see Table 2). Since the ground state of OH+ is split into two levels with a negligible energy difference, we assumed that the population in each level is proportional to its level degeneracy, and included the corresponding correction factor 1.5 in the total column density calculations (see Gupta et al. 2010; Neufeld et al. 2010; Gerin et al. 2010). This gives a simple expression for the total column density, N(OH+) = 4.69 × 10¹²∫τdv cm-2. The column density results are given in Table 2.
H2O+
We derived upper limits for the opacity and the column density of H2O+ assuming a 3σ detection (calculated at the spectral resolution of 1 km s-1) and a line width of 3 km s-1. Like OH+, the ground state of H2O+ is separated into two very close energy levels, and the same correction factor 1.5 must be used to relate the integrated opacity with the column density. This leads to the expression N(H2O+) = 4.28 × 10¹²∫τdv cm-2. The resulting column densities are given in Table 2. For CP1, the noise in the spectrum is too high compared to the continuum level to estimate a reliable upper limit to the column density.
4. Discussion
4.1. Origin of the OH+ and CH+ emission and absorption
The column density ratio N(OH+)/N(H2O+) toward MP1 is higher than 8 for both the blue and red intervals. We can use this ratio to estimate an upper limit to the molecular fraction, f(H2) = 2nH2/(nH + 2nH2), using the relationship [OH+] / [H2O+] = 0.64 + 0.12 × (Tkin/300)(− 0.5)/f(H2) (Gerin et al. 2010). Assuming Tkin = 100 K leads to f(H2) ≲ 0.03, i.e., the regions producing the absorption consist of mainly atomic gas, and most likely correspond to the first layer of the PDR or the UV-irradiated walls of an outflow. Toward the IF and CP1 positions we obtain looser upper limits because of the large rms in the H2O+ spectra. Because the spatial distribution of most of molecular tracers (such as C18O and 13CO) peak toward the molecular bar (Pilleri et al. 2012) whereas atomic tracers such as [C ii] have more a circular spatial distribution (Fig. 3), we expect the molecular fraction to be lower toward the IF and CP1 than torward the molecular bar, represented by the position MP1.
The column density for the red and the blue intervals of OH+ is approximately constant toward all three positions. Even toward CP1, the farthest from the IF and at the edge of the H ii region, OH+ shows spectral profiles and column densities similar to the IF and CP1 position. This suggests that all these absorptions are produced by the same diffuse layers that actually extend for more than 30′′ (0.12 pc) around the IF.
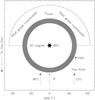 |
Fig. 4 Schematic of the Mon R2 region. The continuum emission is due to the dust grains in the back side of the molecular cloud, and the OH+ and CH+ absorptions come from the PDR layers. |
Several scenarios can be proposed to account for the observed line kinematics. One possible interpretation is that the OH+ absorption comes from two mainly atomic clouds in the line of sight, both unrelated to the UCH ii. This explanation is unlikely for several reasons. First of all, the clouds have similar and large linewidths (~5 km s-1) and it is unlikely that they originate from two separate clouds. Secondly, the [C ii] and CH+ maps (Fig. 3) show that this semi-atomic, red-shifted gas is spatially constrained to the location of the H ii region. The similarity of the CH+ and OH+ absorption velocities suggests that OH+ also originates in this region. A second possibility is that the absorptions comes from the large-scale bipolar outflow associated with this IR cluster (Giannakopoulou et al. 1997; Tafalla et al. 1997; Xu et al. 2006). However, if the absorptions were associated to a bipolar outflow at a certain inclination to the plane of the sky, the red and blue profiles would be significantly different toward MP1 and CP1 which are separated by ~43′′; therefore, we can discard this possibility. We cannot discard, however, the presence of an outflow with a perfect symmetrical pole-on configuration, although it is quite unlikely to have such a perfectly symmetrical pole-on structure.
It is more likely, instead, that the low molecular fraction layers are associated with the PDR around the H ii region. In this case, the profiles of the OH+ line can provide important information about the kinematics of the UCHII region. In the picture of an expanding H ii region (Jaffe et al. 2003), the values of the velocity centroids of the blue- and red-shifted absorption features would provide an upper limit to the expansion velocity of this layer, ~8 km s-1 for the front side and ~4 km s-1for the back side. The main argument against this interpretation is that one would expect to see some changes in the separation between the red and blue absorptions among the observed positions. In the description of Zhu et al. (2005) in which the molecular cloud is sustained by the stellar wind pressure, the atomic gas would be instead entrained in the ionized gas that flows along the walls of the cavity. This last interpretation better explains the absence of a difference in the OH+ profiles toward the three positions. However, an anisotropic expansion or a larger shell could also explain this pattern. Finally, neither the expansion scenario or the Zhu et al. (2005) model are able to fully explain the change in the kinematics between the ionized gas (that peaks at 25 km s-1, see Jaffe et al. 2003) and the atomic gas (that peaks at 15 km s-1, this paper). Thus, our data cannot distinguish between these two interpretations.
In Fig. 4, we show the sketch of a model that is consistent with the observations presented here. The dust grains in the molecular cloud in the back side (relative to the observer) of the H ii region are responsible for the observed continuum emission (see Fig. 1). The OH+ and CH+ absorption signatures come from the mainly atomic layers of the PDR in front of the molecular cloud. The emission of the high density molecular gas in the back of the H ii region produces the observed absorption-emission profile. The continuum emission must be mainly produced by the dust behind the H ii region to allow absorption at both blue-shifted and red-shifted velocities. This means that the gas density and column densities are larger behind the H ii region than in front of it.
4.2. Comparison with chemical models
In our schematic view of Mon R2, the cloud is constituted by spherically symmetric layers of different densities (Fig. 5). The layers surround the H ii region so that the PDRs are found both at the back and at the front of the H ii region. We have used the Meudon PDR code (Le Petit et al. 2006; Goicoechea & Le Bourlot 2007; González-García et al. 2008; Le Bourlot et al. 2012) version 1.4.3 to compare the column densities derived from the observations to those predicted by gas-phase chemical models. Since the Meudon code is a 1D model, these are radial column densities integrated from the beginning of the PDR at r = 0.08 pc. The input parameters of the model and the density structure are the same as in Pilleri et al. (2012, 2013).
The results of the codes are shown in Fig. 5. In the code, most of the OH+ and CH+ is produced at the transition between the atomic and molecular layers at AV ~ 1. The code predicts N(OH+) = 1.35 × 1013 cm-2on each side (back and front) of the sphere, in good agreement with the observed values. This supports that the OH+ absorption is due to the most exposed layers of the PDR. Concerning CH+ the code predicts a column density of 1.6 × 1013 cm-2 on each side of the cloud. This is in reasonable agreement with the column density obtained from the LVG calculations, considering the large uncertainties in the column density and the simplicity of our sketch model. The code also predicts a column density of H2O+ of 6 × 1012 cm-2, in good agreement with our upper limits toward the IF.
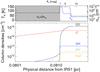 |
Fig. 5 Results of the Meudon PDR code, using the same input parameters as in Pilleri et al. (2012). The upper panel shows the physical conditions as a function of the distance from the IF. The bottom panel shows integrated column densities for the species studied in this work. The shaded area indicates the region where the fraction of molecular to atomic gas, f(H2), is less than 0.1. |
5. Conclusions
We have presented observations of the reactive ions OH+, CH+, and H2O+ of the Monoceros R2 complex obtained with the HIFI instrument on board Herschel. The CH+ join is observed in emission at the bulk velocity of the region and in absorption at blue-shifted velocities. On the other hand, OH+ is observed in absorption at both blue- and red-shifted velocities, with similar opacities and line profiles at the three observed positions in the cloud. The line profiles of the transitions of CH+ and OH+ observed with HIFI allow us to constrain the geometry of the region and study the dynamics of the ionized-to-neutral gas conversion layers.
Based on our observations, we propose a geometrical model in which the column density of dust grains in the back of the H ii region (relative to the observer) is higher than the front. In this model, the OH+ absorption signatures are associated with the layer of mainly atomic gas that surrounds the H ii region. The line profiles of OH+ at all the observed positions are consistent with the scenario of the atomic gas flowing along the walls of the cavity with the ionized gas, as described in Zhu et al. (2005). However, an alternative kinematical scenario consisting in an anisotropic expansion of the UCH ii cannot be excluded based on our dataset.
Acknowledgments
We thank the referee for his useful comments. The authors thank the spanish MINECO for funding support through the grants CSD2009-00038 and AYA2009-07304 and AYA2012-32032. J.R.G. was supported by a Ramon y Cajal contract HIFI has been designed and built by a consortium of institutes and university departments from across Europe, Canada, and the United States under the leadership of SRON Netherlands Institute for Space Research, Groningen, The Netherlands, and with major contributions from Germany, France, and the US. Consortium members are: Canada: CSA, U.Waterloo; France: CESR, LAB, LERMA, IRAM; Germany: KOSMA, MPIfR, MPS; Ireland, NUI Maynooth; Italy: ASI, IFSI-INAF, Osservatorio Astrofisico di Arcetri- INAF; Netherlands: SRON, TUD; Poland: CAMK, CBK; Spain: Observatorio Astronómico Nacional (IGN), Centro de Astrobiología (CSIC-INTA); Sweden: Chalmers University of Technology – MC2, RSS & GARD, Onsala Space Observatory, Swedish National Space Board, Stockholm University – Stockholm Observatory; Switzerland: ETH Zurich, FHNW; USA: Caltech, JPL, NHSC.
References
- Berné, O., Fuente, A., Goicoechea, J. R., et al. 2009, ApJ, 706, L160 [NASA ADS] [CrossRef] [Google Scholar]
- Cernicharo, J. 2012, in EAS Publ. Ser., 58, 251 [Google Scholar]
- Choi, M., Evans, II, N. J., Tafalla, M., & Bachiller, R. 2000, ApJ, 538, 738 [NASA ADS] [CrossRef] [Google Scholar]
- de Graauw, T., Helmich, F. P., Phillips, T. G., et al. 2010, A&A, 518, L6 [NASA ADS] [CrossRef] [EDP Sciences] [Google Scholar]
- Fuente, A., Berné, O., Cernicharo, J., et al. 2010, A&A, 521, L23 [NASA ADS] [CrossRef] [EDP Sciences] [Google Scholar]
- Gerin, M., de Luca, M., Goicoechea, J. R., et al. 2010, A&A, 521, L16 [Google Scholar]
- Giannakopoulou, J., Mitchell, G. F., Hasegawa, T. I., Matthews, H. E., & Maillard, J.-P. 1997, ApJ, 487, 346 [NASA ADS] [CrossRef] [Google Scholar]
- Ginard, D., González-García, M., Fuente, A., et al. 2012, A&A, 543, A27 [NASA ADS] [CrossRef] [EDP Sciences] [Google Scholar]
- Godard, B., Falgarone, E., Gerin, M., et al. 2012, A&A, 540, A87 [NASA ADS] [CrossRef] [EDP Sciences] [Google Scholar]
- Goicoechea, J. R., & Le Bourlot, J. 2007, A&A, 467, 1 [NASA ADS] [CrossRef] [EDP Sciences] [Google Scholar]
- González-García, M., Le Bourlot, J., Le Petit, F., & Roueff, E. 2008, A&A, 485, 127 [NASA ADS] [CrossRef] [EDP Sciences] [Google Scholar]
- Gupta, H., Rimmer, P., Pearson, J. C., et al. 2010, A&A, 521, L47 [NASA ADS] [CrossRef] [EDP Sciences] [Google Scholar]
- Habing, H. J. 1968, Bull. Astr. Inst. Netherlands, 19, 421 [Google Scholar]
- Hollenbach, D., Kaufman, M. J., Neufeld, D., Wolfire, M., & Goicoechea, J. R. 2012, ApJ, 754, 105 [NASA ADS] [CrossRef] [Google Scholar]
- Jaffe, D. T., Zhu, Q., Lacy, J. H., & Richter, M. 2003, ApJ, 596, 1053 [NASA ADS] [CrossRef] [Google Scholar]
- Le Bourlot, J., Le Petit, F., Pinto, C., Roueff, E., & Roy, F. 2012, A&A, 541, A76 [NASA ADS] [CrossRef] [EDP Sciences] [Google Scholar]
- Le Petit, F., Nehmé, C., Le Bourlot, J., & Roueff, E. 2006, ApJS, 164, 506 [NASA ADS] [CrossRef] [EDP Sciences] [Google Scholar]
- Loren, R. B. 1977, ApJ, 215, 129 [CrossRef] [Google Scholar]
- Nagy, Z., Van der Tak, F. F. S., Ossenkopf, V., et al. 2013, A&A, 550, A96 [NASA ADS] [CrossRef] [EDP Sciences] [Google Scholar]
- Neufeld, D. A., Goicoechea, J. R., Sonnentrucker, P., et al. 2010, A&A, 521, L10 [NASA ADS] [CrossRef] [EDP Sciences] [Google Scholar]
- Ossenkopf, V., Röllig, M., Kramer, C., et al. 2011, in EAS Publ. Ser. 52, eds. M. Röllig, R. Simon, V. Ossenkopf, & J. Stutzki, 181 [Google Scholar]
- Ossenkopf, V., Röllig, M., Neufeld, D. A., et al. 2013, A&A, 550, A57 [NASA ADS] [CrossRef] [EDP Sciences] [Google Scholar]
- Ott, S. 2010, in Astronomical Data Analysis Software and Systems XIX, eds. Y. Mizumoto, K.-I. Morita, & M. Ohishi, ASP Conf. Ser., 434, 139 [Google Scholar]
- Pety, J. 2005, in SF2A-2005: Semaine de l’Astrophysique Francaise, eds. F. Casoli, T. Contini, J. M. Hameury, & L. Pagani (EDP Sciences), 721 [Google Scholar]
- Pilbratt, G. L., Riedinger, J. R., Passvogel, T., et al. 2010, A&A, 518, L1 [CrossRef] [EDP Sciences] [Google Scholar]
- Pilleri, P., Fuente, A., Cernicharo, J., et al. 2012, A&A, 544, A110 [NASA ADS] [CrossRef] [EDP Sciences] [Google Scholar]
- Pilleri, P., Treviño-Morales, S., Fuente, A., et al. 2013, A&A, 554, A87 [NASA ADS] [CrossRef] [EDP Sciences] [Google Scholar]
- Rizzo, J. R., Fuente, A., Rodríguez-Franco, A., & García-Burillo, S. 2003, ApJ, 597, L153 [NASA ADS] [CrossRef] [Google Scholar]
- Roelfsema, P. R., Helmich, F. P., Teyssier, D., et al. 2012, A&A, 537, A17 [NASA ADS] [CrossRef] [EDP Sciences] [Google Scholar]
- Tafalla, M., Bachiller, R., Wright, M. C. H., & Welch, W. J. 1997, ApJ, 474, 329 [NASA ADS] [CrossRef] [Google Scholar]
- Xu, Y., Shen, Z.-Q., Yang, J., et al. 2006, AJ, 132, 20 [NASA ADS] [CrossRef] [Google Scholar]
- Zhu, Q.-F., Lacy, J. H., Jaffe, D. T., Richter, M. J., & Greathouse, T. K. 2005, ApJ, 631, 381 [NASA ADS] [CrossRef] [Google Scholar]
- Zhu, Q.-F., Lacy, J. H., Jaffe, D. T., Richter, M. J., & Greathouse, T. K. 2008, ApJS, 177, 584 [NASA ADS] [CrossRef] [Google Scholar]
All Tables
All Figures
|
Fig. 1 In color, the C18O 2−1 integrated intensity in the range [5−15] km s-1 (Pilleri et al. 2012). Squares indicate the positions of the OH+ 1−0 (971 GHz) observations, and the white circles show the HPBW of Herschel at this frequency. White dashed contours show the H(42α) integrated intensity from 1 to 11 K km s-1 in linear steps of 2 K km s-1. Black contours represent the relative variation of the continuum emission at 971 GHz from SPIRE-FTS in 20% intervals of the peak, 0.6 K. |
| In the text | |
|
Fig. 2 Observed spectra of the CH+ (red) and OH+ (black) lines at different positions: the ionization front (IF), the molecular peak 1 (MP1), and the continuum point CP1. The continuum levels have been divided by two to correct for the DSB observations. Vertical dashed lines show the transition velocities, assuming a bulk velocity of the cloud of 11 km s-1. |
| In the text | |
|
Fig. 3 Integrated intensity of the blue ([–5, 5] km s-1), central ([5,12] km s-1), and red ([12, 20] km s-1) intervals of the CH+ 1−0 (color scale) and [C ii] lines (black contours, starting at 15 K km s-1 with a step of 5 K km s-1 for the blue interval, starting at 50 K km s-1 with a step of 50 K km s-1 for the central and red intervals). White contours are the integrated intensity between 5 and 15 km s-1 of the C18O 2−1 line. In the blue interval, the CH+ absorption (dark color) correlates with the molecular cloud. |
| In the text | |
|
Fig. 4 Schematic of the Mon R2 region. The continuum emission is due to the dust grains in the back side of the molecular cloud, and the OH+ and CH+ absorptions come from the PDR layers. |
| In the text | |
|
Fig. 5 Results of the Meudon PDR code, using the same input parameters as in Pilleri et al. (2012). The upper panel shows the physical conditions as a function of the distance from the IF. The bottom panel shows integrated column densities for the species studied in this work. The shaded area indicates the region where the fraction of molecular to atomic gas, f(H2), is less than 0.1. |
| In the text | |
Current usage metrics show cumulative count of Article Views (full-text article views including HTML views, PDF and ePub downloads, according to the available data) and Abstracts Views on Vision4Press platform.
Data correspond to usage on the plateform after 2015. The current usage metrics is available 48-96 hours after online publication and is updated daily on week days.
Initial download of the metrics may take a while.