Fig. 1
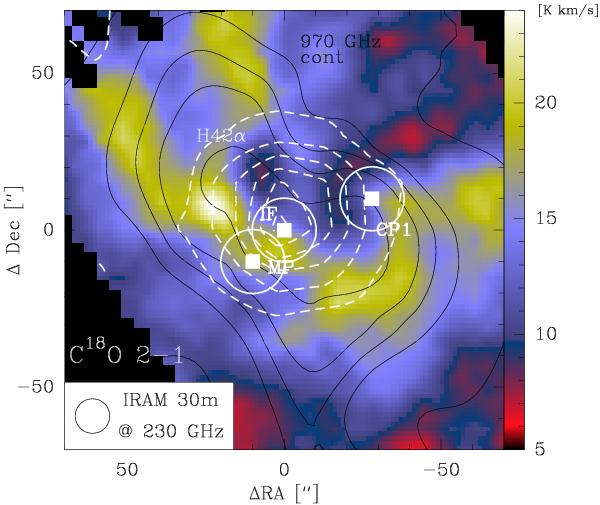
In color, the C18O 2−1 integrated intensity in the range [5−15] km s-1 (Pilleri et al. 2012). Squares indicate the positions of the OH+ 1−0 (971 GHz) observations, and the white circles show the HPBW of Herschel at this frequency. White dashed contours show the H(42α) integrated intensity from 1 to 11 K km s-1 in linear steps of 2 K km s-1. Black contours represent the relative variation of the continuum emission at 971 GHz from SPIRE-FTS in 20% intervals of the peak, 0.6 K.
Current usage metrics show cumulative count of Article Views (full-text article views including HTML views, PDF and ePub downloads, according to the available data) and Abstracts Views on Vision4Press platform.
Data correspond to usage on the plateform after 2015. The current usage metrics is available 48-96 hours after online publication and is updated daily on week days.
Initial download of the metrics may take a while.