Fig. 3
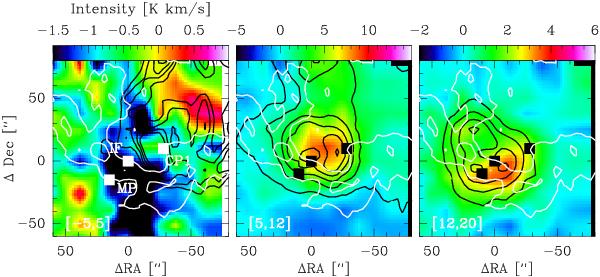
Integrated intensity of the blue ([–5, 5] km s-1), central ([5,12] km s-1), and red ([12, 20] km s-1) intervals of the CH+ 1−0 (color scale) and [C ii] lines (black contours, starting at 15 K km s-1 with a step of 5 K km s-1 for the blue interval, starting at 50 K km s-1 with a step of 50 K km s-1 for the central and red intervals). White contours are the integrated intensity between 5 and 15 km s-1 of the C18O 2−1 line. In the blue interval, the CH+ absorption (dark color) correlates with the molecular cloud.
Current usage metrics show cumulative count of Article Views (full-text article views including HTML views, PDF and ePub downloads, according to the available data) and Abstracts Views on Vision4Press platform.
Data correspond to usage on the plateform after 2015. The current usage metrics is available 48-96 hours after online publication and is updated daily on week days.
Initial download of the metrics may take a while.