Fig. 5
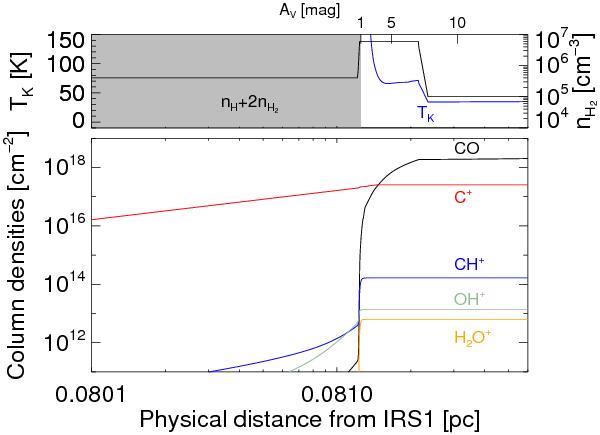
Results of the Meudon PDR code, using the same input parameters as in Pilleri et al. (2012). The upper panel shows the physical conditions as a function of the distance from the IF. The bottom panel shows integrated column densities for the species studied in this work. The shaded area indicates the region where the fraction of molecular to atomic gas, f(H2), is less than 0.1.
Current usage metrics show cumulative count of Article Views (full-text article views including HTML views, PDF and ePub downloads, according to the available data) and Abstracts Views on Vision4Press platform.
Data correspond to usage on the plateform after 2015. The current usage metrics is available 48-96 hours after online publication and is updated daily on week days.
Initial download of the metrics may take a while.