| Issue |
A&A
Volume 560, December 2013
|
|
|---|---|---|
| Article Number | A5 | |
| Number of page(s) | 16 | |
| Section | Galactic structure, stellar clusters and populations | |
| DOI | https://doi.org/10.1051/0004-6361/201322048 | |
| Published online | 28 November 2013 | |
Searching for chemical inhomogeneities in open clusters
Analysis of the CN and CH molecular band strengths in NGC 2158, NGC 2420, NGC 2682, NGC 7789, and Berkeley 29⋆
1 Instituto de Astrofísica de Canarias, La Laguna, 38200 Tenerife, Spain
e-mail: This email address is being protected from spambots. You need JavaScript enabled to view it.
; This email address is being protected from spambots. You need JavaScript enabled to view it.
2 Departamento de Astrofísica, Universidad de La Laguna, 38200 Tenerife, Spain
Received: 10 June 2013
Accepted: 21 August 2013
Abstract
Context. The total mass of a cluster, which is the main parameter determining its ability to host more than one stellar generation, may constitute a threshold below which the cluster is able to form only a single stellar population.
Aims. Our goal is to investigate the existence of star-to-star variations in CN and CH band strengths, which are related to the N and C abundances, respectively, among the stars in five open clusters (NGC 2158, NGC 2420, NGC 2682, NGC 7789, and Berkeley 29). These variations are observed in globular cluster stars and they are linked with the existence of multiple populations. Since these systems are less massive than globular clusters, our results may allow us to constrain the lowest mass necessary to form more than one stellar population.
Methods. We measured the strength of the CN and CH bands, which correlate with the C and N abundances, using four molecular indices in low-resolution SDSS/SEGUE spectra.
Results. For four of the open clusters (NGC 2158, NGC 2420, NGC 2682, and Berkeley 29) we found that all the stars studied in each of them have similar CN and CH band strengths within the uncertainties, since neither anomalous spreads nor bimodalities have been detected in their CN and CH distributions. In contrast, we found an anomalous spread in the strength of the CN molecular band at 3839 Å for NGC 7789, which is larger than the uncertainties. However, the small number of stars studied in this cluster implies that further analysis is needed to confirm the existence of chemical inhomogeneities in this cluster.
Key words: Galaxy: disk / open clusters and associations: general / stars: abundances
Full Table 2 and Tables 4, 6−8 are available in electronic form at http://www.aanda.org
© ESO, 2013
1. Introduction
It seems that almost all properly studied Galactic globular clusters (GCs) host multiple stellar populations that explain the previously known star-to-star variations in the chemical abundances of light elements such as C, N, Na, O, Al and Mg (e.g. Gratton et al. 2012, and references therein). Similar features have been reported in extragalactic GCs (e.g. Letarte et al. 2006; Mucciarelli et al. 2009). Several main-sequence (MS) turn-offs or anomalous spreads in this region have been observed in intermediate-age and young massive clusters in the Magellanic Clouds (e.g. Glatt et al. 2008; Milone et al. 2009). Although several hypotheses have been proposed to explain these findings, the most widely accepted one is the so-called self-enrichment scenario first presented by Da Costa & Cottrell (1980). According to this hypothesis, a stellar cluster has experienced two or more star formation episodes, or extended periods of star formation. Therefore, the subsequent stellar populations born from the interstellar medium have been polluted by material ejected from previous generations. This material may have been synthesized through the CNO cycle, so that the younger populations have become enhanced in He, N, Na and Al and depleted in C, O, Ne, and Mg. Although the main progenitors of this polluted material are still unclear, the most accepted candidates are either intermediate-age asymptotic giant branch (AGB) stars (e.g. D’Antona & Ventura 2007) or fast-rotating massive stars (e.g. Decressin et al. 2007).
The ability of a stellar cluster to retain the polluted material from which the subsequent stellar populations are formed may depend mainly on the gravitational potential of the cluster. Other variables such as age, metallicity, or environment may also play a role in this context. Therefore, a minimum mass may be required to retain the material ejected by the first generations. From an observational point of view, this limit may lie between 104 and 105 M⊙(e.g. Mucciarelli et al. 2009; Carretta et al. 2010). However, these values refer to present-day mass and may have been higher at the moment of the cluster’s formation since it is expected that clusters have lost a significant fraction of their initial mass, in the form of either gas or stars during their lifetime (Baumgardt et al. 2008; Lamers et al. 2010). Theoretical investigations point to an initial mass limit between ~105 and 106 M⊙(e.g. Vesperini et al. 2010; Bekki 2011).
Information about studied clusters.
Only a handful of GCs are known with masses lower than 105 M⊙. Two systems in this mass range, Palomar 12 and Terzan 7, seem not to have star-to-star variations in light element abundances, although only five stars have been studied in the best case (Cohen 2004; Tautvaišienė et al. 2004; Sbordone et al. 2005, 2007). Similar results have been found by Kayser et al. (2008) from the analysis of CN and CH molecular bands, which are related to N and C abundances, respectively, in low-resolution spectra. However, Pancino et al. (2010b) analysed similar data in 23 stars of Palomar 12, finding a clear bimodal distribution of the CN band strengths and anti-correlation with the CH band strengths. Star-to-star variations in Na and O abundances have been detected recently by Geisler et al. (2012) in a sample of 21 giant stars in the old (~8 Gyr, Brogaard et al. 2012) and metal-rich ([Fe/H] ~ +0.40) open cluster (OC) NGC 6791 with a present-day mass similar to that of Palomar 12 and Terzan 7 (104M⊙, Platais et al. 2011). Carrera (2012b, hereafter Paper I) found that the star-to-star variations in the strengths of the CN and CH molecular bands are observed not only in red giant branch (RGB) objects but also among MS stars. Moreover, NGC 6791 shows unexpectedly wide RGB and MS, which could be related to the existence of an age spread of about 1 Gyr (Twarog et al. 2011). However, they could also be explained in terms of the existence of differential line-of-sight reddening (Platais et al. 2011). In contrast, chemical variations in light element abundances have not been observed in a sample of 30 stars in the OC Berkeley 39 (Bragaglia et al. 2012). This cluster has a similar mass and age to that of NGC 6791, although it is more metal-poor ([Fe/H] ~ −0.21). Other investigations on OCs have also investigated the existence of star-to-star variations in light element abundances from high-resolution spectroscopy without success, although the number of stars analysed in each cluster is small (e.g. de Silva et al. 2009; Smiljanic et al. 2009; Pancino et al. 2010a; Carrera & Pancino 2011). The strengths of CN and CH molecular bands in low-resolution spectra have also been studied in several OCs with the same results, although only about ten stars were studied in the best of the cases (e.g. Smith & Norris 1984; Norris & Smith 1985; Martell & Smith 2009). Extended MS turn-offs have also been found in two clusters, SL 529 and SL 862, in the Large Magellanic Cloud (LMC) with masses similar to that of NGC 6791, although they are younger (Milone et al. 2009; Piatti 2013). These features have also been interpreted in terms of the existence of an extended period of star formation in both clusters. However, chemical analyses are needed to confirm, or discard, the existence of the star-to-star abundance variations in the two clusters.
It is essential to better constrain the minimum cluster mass required to form multiple stellar populations. For this purpose, it is necessary to properly sample less massive systems by analysing a statistically significant number of stars. Following the same procedure as used in Paper I, the goal of this paper is to analyse the strengths of the CN and CH molecular bands in stars at different evolutionary stages in five OCs: NGC 2158, NGC 2420, NGC 2682 (M 67), NGC 7789, and Berkeley 29. The last two have present-day masses similar to that of NGC 6791. Although this technique does not supply chemical abundances directly, it does provide valuable information about the existence of star-to-star variations in C and N abundances. The observational material utilized in this paper is presented in Sect. 2. The molecular indices used to determine the CN and CH band strengths are presented in Sect. 3 with the procedure used to obtain their distributions. The results obtained for each cluster are discussed in Sect. 4. Finally, the main results are discussed and summarised in Sects. 5 and 6, respectively.
2. Observational material
In the framework of the Sloan Extension for Galactic and Understanding and Exploration (SEGUE) survey (Yanny et al. 2009), low-resolution (R ~ 2000) spectra were obtained for ~240 000 stars over a wavelength range of 3800−9200 Å. These include several globular and open clusters, including those studied here, which were used to validate the SEGUE Stellar Parameter Pipeline (SSPP, Allende Prieto et al. 2008; Lee et al. 2008a,b). The reduced spectra with atmosphere parameters (Teff, log g, [Fe/H]), radial velocities, etc., derived for observed stars were made public in the eighth Sloan Digital Sky Survey (SDSS) data release (Aihara et al. 2011). Two examples of the spectra analysed in this paper are shown in Fig. 1. The procedure for obtaining this information can be summarised as follows. Raw spectra are first reduced by the SDSS spectroscopic reduction pipeline, as described in detail by Stoughton et al. (2002), which provides flux- and wavelength-calibrated spectra with initial determinations of the radial velocities and spectral types. More accurate radial velocities are calculated in a subsequent step by SSPP, together with determinations of metallicity, effective temperature, and surface gravity.
The same method used in Paper I and fully described by Smolinski et al. (2011) was used to constrain the members of each cluster. In brief, we first rejected those stars located farther than a given distance from the cluster centre (left panels of Fig. 2). The cluster centres and radius used in each case are listed Table 1. In general, this distance has been chosen as half of the tidal radius of each cluster. Exceptional cases were NGC 2158 and NGC 7789 for which we used the tidal radius, since it seems that there are still cluster stars in both cases beyond the assumed tidal radius. In the following step, we used the values provided by SSPP to discard those stars with radial velocities and [Fe/H] that were not within 3σ of the mean radial velocity and [Fe/H] that was assumed for each cluster and listed in Table 1 (right panels of Fig. 2). The total number of stars considered as cluster members from these criteria were 63, 115, 91, 29, and 31 for NGC 2158, NGC 2420, NGC 2682, NGC 7789, and Berkeley 29, respectively.
Although SDSS data releases also provide information about the magnitudes of the target stars, we preferred to use other sources, since the SDSS photometric package is not able to properly handle high-density crowded fields typical of the central areas of clusters, as denoted by An et al. (2008). For NGC 2420 and NGC 2682 we used the photometry obtained by An et al. (2008) in Sloan ugri bandpasses. For the other three systems (NGC 2158, NGC 7789, and Berkeley 29), we used the photometry obtained by Carraro et al. (2002), Gim et al. (1998) and Tosi et al. (2004), respectively. Unfortunately, we have not been able to match all the stars selected as cluster members from the criteria described above with the photometric sources. The total number of stars that meet with these criteria and that also have available photometric magnitudes are 47, 114, 74, 25, and 20 for NGC 2158, NGC 2420, NGC 2682, NGC 7789, and Berkeley 29, respectively. Finally, these stars are grouped as a function of their position in the colour−magnitude diagrams. Selected stars have been over-plotted to the colour−magnitude diagram of each clusters with different symbols as a function of their evolutionary stage in Fig. 3: filled circles, crosses, and open stars for MS, RGB, and red clump (RC) stars, respectively. Stars discarded owing to their position in the colour−magnitude diagram or because their spectra have low signal-to-noise ratios have been plotted with open circles. Since not enough RGB stars have been observed in the clusters of our sample, we restricted our analysis to the MS stars with the exception of NGC 7789, in which the RC objects have been studied. The total number of stars used in each cluster are listed in Col. 8 of Table 1.
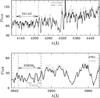 |
Fig. 1 Example of two spectra over-plotted, one in grey (3569) and one in black (4751), for two stars in NGC 7789 with different CN band strengths. The top panel shows the wavelength region which includes the CN band at 4142 Å and the CH band at 4300 Å. The wavelength region which contains the CN band at 3839 Å has been plotted in the bottom panel. The windows used to determine the strength of each molecular band have been marked with horizontal arrows, whereas vertical dashed lines show the edges of these windows. |
3. CN and CH band strenghs
The strengths of the CN molecular bands at 3839 and 4142 Å and the CH band at ~4300 Å were determined using the same indices as defined in Paper I. We refer the reader to this paper and references therein for a detailed discussion about each index. In brief, we used a two index definition for the CN band at 3839 Å by Norris et al. (1981) and Harbeck et al. (2003). Each is optimized to sample RGB and MS stars, respectively. For the other two molecular bands, the CN and CH centred at 4142 Å and 4300 Å, respectively, we used the index definitions by Norris & Freeman (1979) and Lee (1999), respectively. As in Paper I, the uncertainty in each index was calculated by assuming pure photon (Poisson) noise statistics in the flux measurements as in Pancino et al. (2010b). The indices and errors determined with photometric magnitudes for each selected star are listed in Table 2. The median uncertainties for each cluster and index are listed in Table 3.
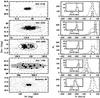 |
Fig. 2 Left: spatial distribution of all stars observed by SEGUE (dots) and those with available photometry (light grey) for each cluster. Dashed lines denote the radii used to select cluster members, which are marked as black circles. Right: radial velocity histograms of all stars observed by SEGUE (grey) and those located within the radii used to select cluster members (black). Dashed lines denote the radial velocity limits used (see Table 1). [Fe/H] distributions of stars selected for their radial velocity and [Fe/H] have been plotted in the inset panels with grey and black lines, respectively. |
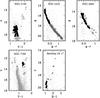 |
Fig. 3 Colour−magnitude diagrams of the five clusters in our sample with the location of our target stars: MS (filled circles); RGB (crosses), RC (stars), and discarded stars either from their position in the colour−magnitude diagram or by low signal-to-noise ratio spectra (open circles). The best photometries available in the literature have been used, although this implies different filter combinations since similar quality photometry for all the clusters in our sample is not available in the same bandpasses. |
Index measurements for the sample stars (excerpt).
Median uncertainties for each cluster and index and the σ of the Gaussian fit to the generalized histogram of each pseudo-index.
Two or more instrumental configurations were employed to observe three of our clusters: NGC 2420, NGC 2682, and Berkeley 29. Therefore, 102 stars in their regions were observed twice. Although none of them are within those selected as cluster members, they are very useful for checking the homogeneity of our data and providing an additional estimation of the uncertainties. To do this, each index was measured separately in the two spectra for each star. On average, the differences between the values obtained for each index for all the stars are: Δ(S3839N) = 0.000 ± 0.005, Δ(S3839H) = 0.000 ± 0.005, Δ(S4142) = 0.003 ± 0.003, and Δ(CH4300) = 0.000 ± 0.003. These differences are negligible, thus ensuring the homogeneity of the index determination used in this paper.
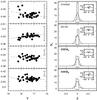 |
Fig. 4 Left: run of the strength of the molecular indices of MS stars in NGC 2158 vs. their V magnitudes. A line has been fitted (dashed line) to remove the temperature and gravity dependence and to obtain the corrected pseudo-indices. Right: normal (histogram) and generalized (solid line) distributions of each corrected pseudo-index. Dashed lines are the best single Gaussians fitted to each generalized distribution. Note that the dashed lines fall so closely to the solid lines in all the cases that it is difficult to distinguish them. The residuals between the single Gaussian and the generalized distribution are shown in the inset panels. |
The strength of each molecular band depends not only on chemical abundance but also on the temperature and surface gravity of the star. Different approaches can be found in the literature to removing this dependence, such as fitting the lower envelope or the median ridge line of a given molecular index as a function of colour or magnitude. In our case, we performed a polynomial least-squares fit on half of the selected stars (randomly selected) in each cluster. For NGC 2158, NGC 7789, and Berkeley 29 we used a linear polynomial, while a quadratic was used in the case of NGC 2420 and NGC 2682, where the selected stars cover a wide magnitude of ranges. This procedure was repeated 103 times using different random subsets each time. The final terms for each index were obtained as the median of the values obtained in each individual test. With this procedure, we tried to minimize the uncertainties due to the low number of object studied and the influence of the points on the edges. The final fits adopted in each case are shown as dashed lines in left panels of Figs. 4−8 and are listed in Table 4. Finally, we calculated the corrected pseudo-indices, denoted by a δ that precedes the corresponding index, as the difference between the index and the adopted fit in each case. Histograms were obtained for each corrected index (right panels of Figs. 4−8). In each case, generalized histograms (solid lines) were derived by assuming that each star is represented by a Gaussian probability function centred on its index value, whose σ is equal to the uncertainty in the determination of the index. The obtained histograms are discussed in depth in the following section.
4. Cluster-by-cluster discussion
4.1. NGC 2158
Because of its apparent spheroidal shape, NGC 2158 was considered as a GC in the past. However, it is an intermediate-age OC (~2 Gyr, Carraro et al. 2002) with a slightly sub-solar metallicity (−0.28, Jacobson et al. 2011) located towards the Galactic anti-centre at a Galactocentric distance Rgc ~ 13.5 kpc. Studies of this cluster have been hampered by the foreground contamination due to its low location in the Galactic plane.
To our knowledge, only two studies have obtained chemical abundances for NGC 2158 stars based on high-resolution spectroscopic analysis (see Carrera & Pancino 2011). These two works obtained different iron abundances. Jacobson et al. (2009) obatined [Fe/H] = −0.03 ± 0.14, whereas Jacobson et al. (2011) derived [Fe/H] = −0.28 ± 0.05. The latter suggests that this difference may be a consequence of the first value having been obtained from only one star and by different temperature scales. Unfortunately, none of these studies provided enough data to investigate the existence of the light element anti-correlations among the NGC 2158 stars.
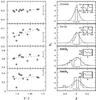 |
Fig. 7 As in Fig. 4 but for RC stars in NGC 7789. In this case the run of each index has been plotted as a function of V − I colours. |
In total, we have measured the CN and CH molecular band strengths for 35 MS stars in this cluster (Fig. 4). In general, a large scatter is observed in the V-index planes (left panels). This scatter can be explained by a large differential reddening in the NGC 2158 area, as is clearly observed in its colour–magnitude diagram (Fig. 3). However, the single Gaussians fitted to the generalized histograms of each index (dashed lines in right panels) have sigmas similar to the average uncertainty in each case (~0.03; see Table 3). There are no signs of bimodalities or anomalous spreads. The band strengths obtained in our analysis are well reproduced by a single Gaussian distribution, as it is denoted by the residuals between the generalized histograms (solid lines) and the fitted single Gaussians (dashed lines) plotted in inset boxes of the right panels. As in this paper, Martell & Smith (2009) analysed the strength of the CN molecular bands for six stars in the upper RGB and RC regions. Although their sample is small in comparison to ours, they found no evidence of star-to-star variations among the NGC 2158 stars, as in our case.
4.2. NGC 2420
NGC 2420 is a ~3 Gyr old intermediate-age OC with a distance modulus of (m − M)V = 11.9 ± 0.3 located beyond the solar circle at a Galactocentric distance of ~11 Kpc and 0.8 Kpc above the Galactic plane (e.g. Pancino et al. 2010a). It has traditionally been considered among the most metal-poor OCs with [Fe/H] = −0.57 ± 0.08 (e.g. Smith & Suntzeff 1987). This has led to NGC 2420 being considered as a transition system between a solar-metallicity OC and metal-poor GC. However, more recent analysis based on high-resolution spectra pointed to an iron content slightly above solar. For example, Pancino et al. (2010a) obtained [Fe/H] = −0.05 ± 0.03 from the analysis of three RC stars, whereas Jacobson et al. (2011) found [Fe/H] = −0.20 ± 0.06 from the study of nine giants. Although Pancino et al. (2010a) derived abundances for Al, Mg, Na, and O, the small number of stars studied does not allow a proper investigation of the existence of (anti-)correlations between the abundances of these elements.
Although 114 MS stars were selected as members of NGC 2420 according to the criteria described in Sect. 2, we have discarded 67 of these because of their low signal-to-noise ratio. We have therefore determined the CN and CH band strengths for 47 MS objects. The run of each of them as a function of g magnitude is shown in the left panels of Fig. 5. Except for the S4142 index, it is observed that the strength of the molecular indices decreases towards brighter magnitudes. The same trends are also observed in NGC 2158 (although probably blurred by the differential reddening in the line of sight), NGC 2682 and Berkeley 29. Similar trends were also found in Paper I for NGC 6791. This is explained because the temperature increases as the magnitude decreases for MS stars. The indices therefore decrease, since the formation of CN and CH molecules is more efficient at lower temperatures. In contrast, the S4142 CN index shows an opposite trend: the strength of this molecular band increases as magnitude decreases. We believe that this trend is artificial, since the variation is lower than the average uncertainty in the strength determinations, which is about ~0.03 (error bars in the left panels of Fig. 5) for the four indices analysed.
The distributions of the pseudo-indices for NGC 2420 are plotted in the right panels of Fig. 5. Again, there are no signs of bimodalities or dispersions larger than those expected from the uncertainties. The sigma of the Gaussian fits (dashed lines in the right panels of Fig. 5) is ~0.03, which is very similar to the average uncertainty of each index (see Table 3). We note that the solid lines almost completely cover the dashed lines for all the indices studied (right panels of Fig. 5). From the residuals shown in the inset panels, it seems however that the generalized histograms are not exactly Gaussian. In any case, the symmetrical behaviour of these residuals only implies that the generalized histograms have a higher peak and wider wings than a Gaussian, but there is no evidence of the existence of multiple statistical populations. McClure et al. (1974) analysed DDO photometry in the C(41 − 42) bandpass, which includes the CN molecular band at 4142 Å for 12 giant stars in NGC 2420. As in our case, they found that all the studied stars have similar C(41 − 42) magnitudes and therefore, similar CN band strengths.
4.3. NGC 2682 (M 67)
NGC 2682 is a ~4.5 Gyr old and solar metallicity cluster with [Fe/H] = + 0.05 ± 0.03 (see Pancino et al. 2010a, and references therein). It is one of the most well-studied OCs due to its low reddening, E(B − V) = 0.04 ± 0.02, and proximity, (m − M)V = 9.67 ± 0.11. Chemical abundances from high-resolution spectroscopy have been derived by several studies using different spectral-type stars in NGC 2682 (see Carrera & Pancino 2011, for a recent compilation). All of them agree on a similar iron content to that of the Sun. Many of these studies have also derived abundances of light elements such as C, N, Al, Mg, Na, and O. There is a wide spread among the values obtained by different authors for Mg and Na, which may be explained by the difficulties in measuring these elements, as pointed out by Pancino et al. (2010a). As in the case of NGC 2420, these authors derived Al, Mg, Na, and O abundances, but the small number of stars analysed prevented them from obtaining conclusions about the existence of (anti)-correlations among them.
In this case, we have determined the band strengths of 46 MS stars that show well defined sequences in the g-index planes (left panels of Fig. 6). The median uncertainties in the determination of the strengths of each index are between 0.03 and 0.04 (Table 3). In contrast with the other clusters in our sample, the strengths of the four indices studied increase towards fainter magnitudes, and therefore towards lower temperatures, as expected theoretically and observed in GCs (e.g Pancino et al. 2010b) and in NGC 6791 (Paper I). The generalized distributions obtained for each pseudo-index (right panels) are very well reproduced by Gaussians, as the very small residuals plotted in the inset panels denote. In the right panels of Fig. 6 we note that solid and dashed lines overlap. With dispersions similar to the median uncertainties for each index this implies that all the stars analysed in NGC 2682 have very similar CN and CH band strengths, and therefore, C and N abundances. The sigmas of the Gaussians fitted to each generalized histogram are listed in Table 3. As in the case of NGC 2420, our results are in good agreement with the conclusions obtained from DDO photometry in 36 red giant stars studied by Janes & Smith (1984).
4.4. NGC 7789
NGC 7789 is a ~1.5 Gyr old OC located at a Galactocentric distance of Rgc ~ 9.4 kpc and is about 0.2 kpc below the Galactic disc plane, which explains the relatively high reddening in its line of sight, E(B − V) = 0.27 ± 0.04 (see Pancino et al. 2010a, and references therein). Although studies based on photometry and low resolution spectroscopy assign a sub-solar metallicity to this cluster at [Fe/H] ~ − 0.24 ± 0.09 (e.g., Friel et al. 2002), high-resolution spectroscopic studies have found an iron content similar to that of the Sun: [Fe/H] = + 0.04 ± 0.07 (Pancino et al. 2010a). Although Pancino et al. (2010a) derived Al, Mg, Na, and O abundances in three RC stars, the small number of objects studied does not allow the existence of usual (anti)-correlations observed in GCs to be investigated.
In contrast with the other clusters in our sample, we have restricted our analysis of NGC 7789 to 11 RC stars, because no MS objects were observed in this cluster. Since RC objects are located almost at the same luminosity, it is not useful to use the magnitude to remove the temperature and gravity dependences. For this reason, we have plotted the run of the index strengths as a function of V − I colour in the left panels of Fig. 7. Although the uncertainties in the four indices are relatively large (see Table 3), the expected increase in the band strengths towards redder colours, and therefore, towards lower temperatures is observed in all of them. The CH4300 index shows a unimodal distribution within the uncertainties, as has been observed in the other clusters studied here. However, the S4142 index shows a generalized histogram that although it is relatively well fitted by a single Gaussian has a sigma that is slightly larger than the average uncertainty. Hints of bimodalities are observed in the histograms of both S3839H and S3839N which is particular in the latter, defined to sample giant stars, such as on the RC. However, these bimodalities are smoothed when the generalized distributions are obtained by considering their uncertainties. However, none of them is well reproduced by a single Gaussian, as the residuals plotted in inset boxes of the right panels indicate. This broadening is not explained by the uncertainties, since the sigmas obtained from the single Gaussian fits are larger than the average error bars (see Table 3). We have also investigated the possibility that the observed scatter is independent of the V magnitude, i.e. if the stars analysed are in different evolutionary stages. The star with the lower S3839H index is the faintest one with V = 13.4. There are no other stars in our sample with similar magnitudes. Therefore, its lower CN band strengths could be explained by the fact that this star would be in a different evolutionary stage that the others. In contrast, we find that the objects with lower CN band strengths have almost the same magnitudes than others with higher values for the other stars analysed. We have also investigated to see if our result is influenced by the existence of binaries in our sample. According to the WEBDA database, only two stars in our sample are spectroscopic binaries. These stars, 8383 and 9831, fall in the most populated part of the V − I vs. indices diagrams at around V − I ~ 1.32. The unexpected broadenings observed in the generalized histograms of S3839H and S3839N indices do not disappear if these stars are removed from the sample. Therefore, we conclude that our result is not explained by the existence of stars in different evolutionary stages or binaries in our sample. The spectra of two stars with similar V − I colours but different S3839H and S3839N strengths are shown in Fig. 1. A similar behaviour was observed in NGC 6791 RC stars in Paper I. However, both the small number of stars sampled and the relatively low signal-to-noise ratio of the spectra used in our analysis prevent us from drawing more conclusions, which implies large uncertainties. Although we cannot confirm the existence of star-to-star variation in CN band strengths, we also cannot discard them. The DDO photometry were obtained by Janes (1977) for 22 giants in NGC 7789. From the analysis of the magnitudes obtained in the C(41 − 42) bandpass, they did not find evidence of an intrinsic range of CN strengths in contradiction with the result obtained here. However, the lower sensitivity of the CN molecular band at 4142 Å compared to the one located at 3839 Å may explain this discrepancy.
4.5. Berkeley 29
Berkeley 29 is a very interesting cluster because of its location towards the Galactic anti-centre in the outskirts of the Galactic disc at a Galactocentric distance of Rgc ~ 23 Kpc and height of ~2 Kpc above the disc. Its intermediate-age, ~3.5 Gyr, and low metallicity, [Fe/H] ~ − 0.4, (e.g. Tosi et al. 2004; Bragaglia et al. 2005) match within the framework of Galactic evolution, despite the suggestion by Frinchaboy et al. (2004) that Berkeley 29 is associated with the Canis Major overdensity. Because Berkeley 29 is a very interesting object, we have included it in our sample despite the low number of stars selected as members in comparison to the other systems analysed with the exception of NGC 7789.
Of the 20 objects selected as Berkeley 29 members from the criteria described in Sect. 2, we have determined CN and CH band strengths for only nine MS stars. Their run as a function of V magnitudes are shown in the left panels of Fig. 8. The trends are similar to those observed in other clusters in our sample, although the scatter is larger because of the larger uncertainties motivated by the lower signal-to-noise ratios of the spectra acquired for Berkeley 29 stars. Moreover, the generalized histograms for each pseudo-index are well reproduced by single Gaussians with sigmas similar to the median uncertainties in each case (see Table 3). This implies that the generalized histograms are mainly modulated by the large uncertainties in the determinations of the four molecular indices analysed, which prevents us from obtaining any conclusion about the existence of star-to-star variations. Within the uncertainties, we therefore conclude that we find no evidence of the existence of significant differences in the strengths of the CN and CH molecular bands and in the abundances of the analysed stars.
List of previously studied open clusters.
5. Discussion
The existence of multiple populations has been reported in massive clusters with a wide range of ages from old GCs to intermediate-age and young populous systems in the Magellanic Clouds. They are clearly linked with the star-to-star variations in light element chemical abundances reported in almost all properly studied GCs in the Galaxy, in the LMC, and Fornax dwarf spheroidal galaxy. However, the same chemical inhomogeneities have not been observed in intermediate-age populous clusters of the LMC (Mucciarelli et al. 2008; Walker et al. 2011). For whatever processes may be responsible for the formation of multiple populations in stellar clusters, it appears that it is mainly related to their total mass, since only systems massive enough are able to retain the material ejected by the first generation, from which the subsequent populations are formed. Thus, there should be a mass limit below which clusters are unable to retain the ejected material and to form other stellar generations. According to dynamical models, this mass threshold is between ~105 and 106 M⊙(e.g. Vesperini et al. 2010; Bekki 2011).
Constraining this limit from an observational point of view is challenging, since clusters lose a significant fraction of their initial masses during their lifetimes as a function of stellar evolution (e.g., material removed by supernova explosions or strong winds) and by tidal stripping. However, investigating less massive clusters helps to restrict the minimum mass required. In this paper, we have studied the behaviour of the CN and CH molecular band strengths in five OCs. Four of them (NGC 2158, NGC 2420, NGC 2682, and Berkeley 29) have unimodal CN and CH band distributions within the uncertainties, suggesting that they harbour a simple and chemically homogeneous population. In the case of the most massive of these clusters, Berkeley 29, the uncertainties are large enough to erase any sign of either bimodalities or broadening in the obtained distributions. In contrast, for NGC 7789, which has a mass similar to that of NGC 6791, we detected an anomalous spread in the distribution of the CN band strengths despite the large uncertainties in the index determinations for stars in this cluster.
To put our results in a general context, we used the age-MV plane originally proposed by Carretta et al. (2010), where MV is used as an indicator of the present-day total mass of the clusters. In Fig. 9, we have plotted several OCs with filled triangles. Those studied here and in Paper I are marked with open circles. the only OC where the existence of star-to-star variations in light element abundances have been confirmed, NGC 6791, has been coloured in green. The OC NGC 7789 has been coloured in magenta, since we have found evidence of the existence of chemical inhomogeneities in its stars. Systems with no signs of multiple populations, including those studied here and others previously investigated in the literature (Table 5), are coloured in red. Other interesting OCs that have not been studied yet are in grey. Star-to-star variations in light element abundances have been investigated in several OCs (e.g. de Silva et al. 2009; Smiljanic et al. 2009; Pancino et al. 2010a; Carrera & Pancino 2011). However, the number of stars analysed in each system is very small, and these have not been considered in our analysis. Following the same colour code, we have also plotted Galactic GCs (filled circles) and cluters in other external galaxies (open stars with differing numbers of branches). These clusters and the references used are listed in Tables 6, 7 and 8. Lines of constant mass for different metallicities have been superimposed for reference. They have been computed from the simple stellar population models derived by Maraston (1998, 2005), assuming the Kroupa (2001) initial mass function1.
No evidence of the existence of multiple populations has been reported for any of the five Galactic OCs studied with MV > − 4. In particular, we have analysed a statistically significant number of stars in three systems in this magnitude range (NGC 2158, NGC 2420, and NGC 2682), and we do not find any hint of chemical inhomogeneities. We conclude that clusters with MV > − 4 or masses lower than ~104 M⊙ are not massive enough to form a second stellar generation.
Independent of their parent galaxy, almost all clusters older than ~9 Gyr are massive enough to host multiple stellar populations. Moreover, almost all these systems show star-to-star variations in light element abundances. The exceptions are the two Galactic GCs NGC 5466 and IC 4479, where no anomalous colour spreads in the ultraviolet have been detected by Lardo et al. (2011) or Walker et al. (2011). However, a similar result was found by Lardo et al. (2011) in NGC 2419, but an unnaturally wide RGB was later found by Beccari et al. (2013) using higher quality photometry. To our knowledge, the existence of star-to-star chemical abundance variations has not been studied until now in these two clusters.
SMC clusters with ages between 6 and 8 Gyr do not show unnatural features in their colour–magnitude diagrams to host multiple stellar populations despite their mass of MV ~ − 8. However, these features have been observed in clusters with ages younger than ~2.5 Gyr, in both the SMC (Glatt et al. 2008) and in the LMC (e.g., Milone et al. 2009; Piatti 2013). There are some exceptions, such as the massive cluster SL556 (MV ~ − 9.5) in the LMC (e.g. Bertelli et al. 2003). In contrast, star-to-star variations in light element abundances similar to those observed in GC have not been observed in intermediate-age LMC clusters (Mucciarelli et al. 2008, 2011). However, almost all the clusters analysed (NGC 1651, NGC 1866, and NGC 2173) also show no unnatural spreads in the MS turn-off region. The only exception is NGC 1783, where neither an anomalous MS turn-off (Milone et al. 2009) nor chemical inhomogeneities (Mucciarelli et al. 2008) have been initially reported, although a more accurate analysis of the MS turn-off region has revealed an unnatural spread (Platais et al. 2011). In any case, more determination of chemical abundances of stars in these clusters and in those with unnatural or multiple MS turn-offs are needed to confirm that clusters younger than ~2.5 Gyr are able to form multiple populations without the chemical inhomogeneities observed in old GC stars.
According to Fig. 9, the mass limit for forming multiple populations is between MV ~ − 4 and −5. Unfortunately, the number of clusters studied in this range is small. Unnatural MS turn-offs have been observed in two LMC young clusters, SL 529 and SL 862, in this magnitude range as observed by Piatti (2013) and Milone et al. (2009), respectively. However, they have not been reported in slightly more massive clusters at MV ~ − 5.5. The only GC in this range is Palomar 12, which is associated with the Sagittarius dwarf spheroidal galaxy. As was explained in Sect. 1, star-to-star variations in light element abundances derived from high resolution spectroscopy have not been reported in this cluster (Cohen 2004). However, only four stars have been analysed. In the same way, Kayser et al. (2008) find no significant variations in the CN band stengths in their analysis of low-resolution spectra of 14 RGB stars in Palomar 12. In contrast, a clear bimodal anti-correlation of the CH and CN band strengths has been observed by Pancino et al. (2010b) by analysing 23 stars in the MS turn-off region. Since there is no agreement about the existence of chemical inhomogenities in Palomar 12, we have coloured this cluster in magenta in Fig. 9. The other four systems in this magnitude range are OCs. Both chemical inhomogeneities in light element abundances that are derived from high-resolution spectroscopy (Geisler et al. 2012) and variations in the CN band strength that are measured in low-resolution spectra (Paper I) have been reported in the metal-rich OC NGC 6791. Moreover, this cluster shows unnaturally wide RGB and MS sequences (Carraro et al. 2006). However, star-to-star variations have not been observed in Berkeley 39 (Bragaglia et al. 2012). Although both systems have a similar present-day mass, it seems that NGC 6791 had a higher initial mass than Berkeley 29. The cluster NGC 6791 would have lost a significant fraction of its initial mass during repeated crossings of the denser parts of the disc. The remaining OCs NGC 7789 and Berkeley 29 are those studied here. Only nine stars have been analysed in the case of Berkeley 29. The uncertainties of the index determinations are large, which would erase any sign of bimodality or anomalous spread because of the low signal-to-noise ratio of the spectra used. In contrast, we found an anomalous spread in the case of NGC 7789, which is not explained by the uncertainties in the distribution of CN band strength at 3839 Å (Fig. 7). Although more studies are needed to confirm this result, it has a similar age and mass as the two LMC clusters where unnatural MS turn-offs have been reported.
Although much work remains to be done, the minimum present-day mass, according to Fig. 9 required for a cluster to be able to retain the material ejected by the first stellar generation and form subsequent populations is ~104 M⊙. There are some clusters with a present-day mass similar to this that do not host multiple stellar populations. This may be because they have lost a low amount of mass during their lifetimes in comparison to other systems with similar present-day mass that were initially more massive. This value is lower than the mass threshold of 104−105 M⊙, as proposed by Mucciarelli et al. (2009); Carretta et al. (2010).
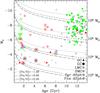 |
Fig. 9 Age versus MV (as a proxy for mass) for Galactic OCs (triangles) and GCs (filled circles). Clusters in other galaxies have been marked with stars with differing numbers of branches: LMC (four), Small Magellanic Cloud (SMC, five), Sagittarius (six), and Fornax (seven). Clusters for which either multiple sequences in the colour−magnitude diagrams, chemical inhomogeneities, or both have been detected are in green, whereas clusters without either are in red. In magenta are clusters for which there are doubts about the existence of chemical inhomogeneities. Clusters not properly studied are in grey. Clusters studied here are encircled. Lines of constant mass for different metallicities have been superimposed (See text for detail). |
6. Summary
We have studied the strengths of the CN and CH bands at 3839, 4142 and 4300 Å in the MS stars of NGC 2158, NGC 2420, NGC 2682 (M 67), and Berkeley 29 and the RC objects of NGC 7789. For this analysis, we used low-resolution spectra (R ~ 2000) obtained in the framework of the SEGUE project within the SDSS.
Our main results are as follows:
-
The molecular indices describe unimodal distributions for starsin NGC 2158, NGC 2420,NGC 2682, and Berkeley 29. All ofthem are well reproduced by single Gaussians with sigmassimilar to the average uncertainties. Therefore, stars in theseclusters have homogeneous abundances of C and N.
-
Hints of bimodalities have been found in the distributions of the strength of the CN molecular band at 3839 Å for stars in NGC 7789. Although these features are smoothed when the uncertainties are considered, the generalized histograms still show a spread wider than that expected from the error bars. More analysis is needed to confirm the existence of star-to-star variations in the CN strengths of stars in this cluster because of the small number of objects studied here.
-
We have discussed our results in the framework of the formation of multiple stellar populations in stellar clusters of different ages and environments. We find that the present-day mass limit above which a cluster may be able to host multiple stellar populations is ~104 M⊙.
Online material
Index measurements for the sample stars.
Acknowledgments
We acknowledge the anonymous referee and the editor, Eline Tolstoy, for their useful comments which have contributed to clarify the presentation of our results. CEMV acknowledges the funds by the Instituto de Astrofísica de Canarias under the Summer Grant Programme. R.C. acknowledges funds provided by the Spanish Ministry of Science and Innovation under the Juan de la Cierva fellowship and under the Plan Nacional de Investigación Científica, Desarrollo, e Investigación Tecnológica, AYA2010-16717. This research has made use of the WEBDA database, operated at the Institute for Astronomy of the University of Vienna, and the SIMBAD database, operated at the CDS, Strasbourg, France. Funding for SDSS-III has been provided by the Alfred P. Sloan Foundation, the Participating Institutions, the National Science Foundation, and the U.S. Department of Energy Office of Science. The SDSS-III web site is http://www.sdss3.org/. SDSS-III is managed by the Astrophysical Research Consortium for the Participating Institutions of the SDSS-III Collaboration including the University of Arizona, the Brazilian Participation Group, Brookhaven National Laboratory, University of Cambridge, University of Florida, the French Participation Group, the German Participation Group, the Instituto de Astrofísica de Canarias, the Michigan State/Notre Dame/JINA Participation Group, Johns Hopkins University, Lawrence Berkeley National Laboratory, Max Planck Institute for Astrophysics, New Mexico State University, New York University, Ohio State University, Pennsylvania State University, University of Portsmouth, Princeton University, the Spanish Participation Group, University of Tokyo, University of Utah, Vanderbilt University, University of Virginia, University of Washington, and Yale University.
References
- Aihara, H., Allen de Prieto, C., An, D., et al. 2011, ApJS, 193, 29 [NASA ADS] [CrossRef] [Google Scholar]
- Allen de Prieto, C., Sivarani, T., Beers, T. C., et al. 2008, AJ, 136, 2070 [NASA ADS] [CrossRef] [Google Scholar]
- An, D., Johnson, J. A., Clem, J. L., et al. 2008, ApJS, 179, 326 [NASA ADS] [CrossRef] [Google Scholar]
- Baumgardt, H., De Marchi, G., & Kroupa, P. 2008, ApJ, 685, 247 [NASA ADS] [CrossRef] [Google Scholar]
- Baumgardt, H., Parmentier, G., Anders, P., & Grebel, E. K. 2013, MNRAS, 430, 676 [NASA ADS] [CrossRef] [Google Scholar]
- Beccari, G., Bellazzini, M., Lardo, C., et al. 2013, MNRAS, 431, 1995 [NASA ADS] [CrossRef] [Google Scholar]
- Bekki, K. 2011, MNRAS, 412, 2241 [NASA ADS] [CrossRef] [Google Scholar]
- Bertelli, G., Nasi, E., Girardi, L., et al. 2003, AJ, 125, 770 [NASA ADS] [CrossRef] [Google Scholar]
- Bragaglia, A., Held, E. V., & Tosi, M. 2005, A&A, 429, 881 [NASA ADS] [CrossRef] [EDP Sciences] [Google Scholar]
- Bragaglia, A., Gratton, R. G., Carretta, E., et al. 2012, A&A, 548, A122 [NASA ADS] [CrossRef] [EDP Sciences] [Google Scholar]
- Bica, E., Claria, J. J., Dottori, H., Santos, J. F. C., Jr., & Piatti, A. E. 1996, ApJS, 102, 57 [NASA ADS] [CrossRef] [Google Scholar]
- Brogaard, K., VandenBerg, D. A., Bruntt, H., et al. 2012, A&A, 543, A106 [NASA ADS] [CrossRef] [EDP Sciences] [Google Scholar]
- Carraro, G., Girardi, L., & Marigo, P. 2002, MNRAS, 332, 705 [NASA ADS] [CrossRef] [Google Scholar]
- Carraro, G., Villanova, S., Demarque, P., et al. 2006, ApJ, 643, 1151 [Google Scholar]
- Carrera, R. 2012a, A&A, 544, A109 [NASA ADS] [CrossRef] [EDP Sciences] [Google Scholar]
- Carrera, R. 2012b, ApJ, 758, 110 Paper I [NASA ADS] [CrossRef] [Google Scholar]
- Carrera, R., & Pancino, E. 2011, A&A, 535, A30 [NASA ADS] [CrossRef] [EDP Sciences] [Google Scholar]
- Carrera, R., Gallart, C., Pancino, E., & Zinn, R. 2007, AJ, 134, 1298 [NASA ADS] [CrossRef] [Google Scholar]
- Carretta, E., Bragaglia, A., Gratton, R. G., et al. 2010, A&A, 516, A55 [NASA ADS] [CrossRef] [EDP Sciences] [Google Scholar]
- Carretta, E., Lucatello, S., Gratton, R. G., Bragaglia, A., & D’Orazi, V. 2011, A&A, 533, A69 [NASA ADS] [CrossRef] [EDP Sciences] [Google Scholar]
- Chen, W. P., Chen, C. W., & Shu, C. G. 2004, AJ, 128, 2306 [NASA ADS] [CrossRef] [Google Scholar]
- Cohen, J. G. 2004, AJ, 127, 1545 [NASA ADS] [CrossRef] [Google Scholar]
- Cohen, J. G., & Melendez, J. 2005, AJ, 129, 1607 [NASA ADS] [CrossRef] [Google Scholar]
- D’Antona, F., & Ventura, P. 2007, MNRAS, 379, 1431 [NASA ADS] [CrossRef] [Google Scholar]
- Da Costa, G. S., & Cottrell, P. L. 1980, ApJ, 236, L83 [NASA ADS] [CrossRef] [Google Scholar]
- de Silva, G. M., Gibson, B. K., Lattanzio, J., & Asplund, M. 2009, A&A, 500, L25 [NASA ADS] [CrossRef] [EDP Sciences] [MathSciNet] [Google Scholar]
- Decressin, T., Meynet, G., Charbonnel, C., Prantzos, N., & Ekström, S. 2007, A&A, 464, 1029 [NASA ADS] [CrossRef] [EDP Sciences] [Google Scholar]
- Dias, W. S., Alessi, B. S., Moitinho, A., & Lépine, J. R. D. 2002, A&A, 389, 871 [NASA ADS] [CrossRef] [EDP Sciences] [Google Scholar]
- Ferraro, F. R., Dalessandro, E., Mucciarelli, A., et al. 2009, Nature, 462, 483 [NASA ADS] [CrossRef] [PubMed] [Google Scholar]
- Friel, E. D., Janes, K. A., Tavarez, M., et al. 2002, AJ, 124, 2693 [NASA ADS] [CrossRef] [Google Scholar]
- Frinchaboy, P. M., Majewski, S. R., Crane, J. D., et al. 2004, ApJ, 602, L21 [NASA ADS] [CrossRef] [Google Scholar]
- Geisler, D., Villanova, S., Carraro, G., et al. 2012, ApJ, 756, L40 [NASA ADS] [CrossRef] [Google Scholar]
- Gim, M., Vandenberg, D. A., Stetson, P. B., Hesser, J. E., & Zurek, D. R. 1998, PASP, 110, 1318 [NASA ADS] [CrossRef] [Google Scholar]
- Girardi, L., Goudfrooij, P., Kalirai, J. S., et al. 2013, MNRAS, 431, 3501 [NASA ADS] [CrossRef] [Google Scholar]
- Glatt, K., Grebel, E. K., Sabbi, E., et al. 2008, AJ, 136, 1703 [NASA ADS] [CrossRef] [Google Scholar]
- Glatt, K., Grebel, E. K., Gallagher, J. S. III, et al. 2009, AJ, 138, 1403 [NASA ADS] [CrossRef] [Google Scholar]
- Goudfrooij, P., Puzia, T. H., Kozhurina-Platais, V., & Chandar, R. 2011, ApJ, 737, 3 [NASA ADS] [CrossRef] [Google Scholar]
- Gratton, R. G., Carretta, E., & Bragaglia, A. 2012, A&ARv, 20, 50 [CrossRef] [Google Scholar]
- Gray, D. F. 1965, AJ, 70, 362 [NASA ADS] [CrossRef] [Google Scholar]
- Harbeck, D., Smith, G. H., & Grebel, E. K. 2003, AJ, 125, 197 [NASA ADS] [CrossRef] [Google Scholar]
- Hufnagel, B., Smith, G. H., & Janes, K. A. 1995, AJ, 110, 693 [NASA ADS] [CrossRef] [Google Scholar]
- Jacobson, H. R., Friel, E. D., & Pilachowski, C. A. 2009, AJ, 137, 4753 [NASA ADS] [CrossRef] [Google Scholar]
- Jacobson, H. R., Pilachowski, C. A., & Friel, E. D. 2011, AJ, 142, 59 [NASA ADS] [CrossRef] [Google Scholar]
- Janes, K. A. 1977, AJ, 82, 35 [NASA ADS] [CrossRef] [Google Scholar]
- Janes, K. A., & Smith, G. H. 1984, AJ, 89, 487 [NASA ADS] [CrossRef] [Google Scholar]
- Johnson, J. A., Ivans, I. I., & Stetson, P. B. 2006, ApJ, 640, 801 [NASA ADS] [CrossRef] [Google Scholar]
- Harris, W. E. 1996, AJ, 112, 1487 [NASA ADS] [CrossRef] [Google Scholar]
- Kacharov, N., Koch, A., & McWilliam, A. 2013, A&A, 554, A81 [NASA ADS] [CrossRef] [EDP Sciences] [Google Scholar]
- Kayser, A., Hilker, M., Grebel, E. K., & Willemsen, P. G. 2008, A&A, 486, 437 [NASA ADS] [CrossRef] [EDP Sciences] [Google Scholar]
- Keller, S. C., Mackey, A. D., & Da Costa, G. S. 2012, ApJ, 761, L5 [NASA ADS] [CrossRef] [Google Scholar]
- Kharchenko, N. V., Piskunov, A. E., Röser, S., et al. 2009, A&A, 504, 681 [NASA ADS] [CrossRef] [EDP Sciences] [Google Scholar]
- Koch, A., Côté, P., & McWilliam, A. 2009, A&A, 506, 729 [NASA ADS] [CrossRef] [EDP Sciences] [Google Scholar]
- Kroupa, P. 2001, MNRAS, 322, 231 [NASA ADS] [CrossRef] [Google Scholar]
- Lamers, H. J. G. L. M., Baumgardt, H., & Gieles, M. 2010, MNRAS, 409, 305 [NASA ADS] [CrossRef] [Google Scholar]
- Lardo, C., Bellazzini, M., Pancino, E., et al. 2011, A&A, 525, A114 [NASA ADS] [CrossRef] [EDP Sciences] [Google Scholar]
- Lata, S., Pandey, A. K., Sagar, R., & Mohan, V. 2002, A&A, 388, 158 [NASA ADS] [CrossRef] [EDP Sciences] [Google Scholar]
- Lee, S.-G. 1999, AJ, 118, 920 [NASA ADS] [CrossRef] [Google Scholar]
- Lee, Y. S., Beers, T. C., Sivarani, T., et al. 2008a, AJ, 136, 2022 [NASA ADS] [CrossRef] [Google Scholar]
- Lee, Y. S., Beers, T. C., Sivarani, T., et al. 2008b, AJ, 136, 2050 [NASA ADS] [CrossRef] [Google Scholar]
- Letarte, B., Hill, V., Jablonka, P., et al. 2006, A&A, 453, 547 [NASA ADS] [CrossRef] [EDP Sciences] [Google Scholar]
- Mackey, A. D., & Gilmore, G. F. 2003a, MNRAS, 338, 85 [NASA ADS] [CrossRef] [Google Scholar]
- Mackey, A. D., & Gilmore, G. F. 2003b, MNRAS, 338, 120 [NASA ADS] [CrossRef] [Google Scholar]
- Mackey, A. D., & Gilmore, G. F. 2003c, MNRAS, 340, 175 [NASA ADS] [CrossRef] [Google Scholar]
- Maraston, C. 1998, MNRAS, 300, 872 [NASA ADS] [CrossRef] [Google Scholar]
- Maraston, C. 2005, MNRAS, 362, 799 [NASA ADS] [CrossRef] [Google Scholar]
- Martell, S. L., & Smith, G. H. 2009, PASP, 121, 577 [NASA ADS] [CrossRef] [Google Scholar]
- McClure, R. D., Forrester, W. T., & Gibson, J. 1974, ApJ, 189, 409 [NASA ADS] [CrossRef] [Google Scholar]
- Milone, A. P., Bedin, L. R., Piotto, G., & Anderson, J. 2009, A&A, 497, 755 [NASA ADS] [CrossRef] [EDP Sciences] [Google Scholar]
- Milone, A. P., Bedin, L. R., Cassisi, S., et al. 2013, A&A, 555, A143 [NASA ADS] [CrossRef] [EDP Sciences] [Google Scholar]
- Monelli, M., Milone, A. P., Stetson, P. B., Marino, A. F., et al. 2013, MNRAS, 431, 2126 [NASA ADS] [CrossRef] [Google Scholar]
- Mucciarelli, A., Carretta, E., Origlia, L., & Ferraro, F. R. 2008, AJ, 136, 375 [NASA ADS] [CrossRef] [Google Scholar]
- Mucciarelli, A., Origlia, L., Ferraro, F. R., & Pancino, E. 2009, ApJ, 695, L134 [NASA ADS] [CrossRef] [Google Scholar]
- Mucciarelli, A., Cristallo, S., Brocato, E., et al. 2011, MNRAS, 413, 837 [NASA ADS] [CrossRef] [Google Scholar]
- Norris, J., & Freeman, K. C. 1979, ApJ, 230, L179 [NASA ADS] [CrossRef] [Google Scholar]
- Norris, J., & Smith, G. H. 1985, AJ, 90, 2526 [NASA ADS] [CrossRef] [Google Scholar]
- Norris, J., Cottrell, P. L., Freeman, K. C., & Da Costa, G. S. 1981, ApJ, 244, 205 [NASA ADS] [CrossRef] [Google Scholar]
- Origlia, L., Rich, R. M., Ferraro, F. R., et al. 2011, ApJ, 726, L20 [NASA ADS] [CrossRef] [Google Scholar]
- Pancino, E., Carrera, R., Rossetti, E., & Gallart, C. 2010a, A&A, 511, A56 [NASA ADS] [CrossRef] [EDP Sciences] [Google Scholar]
- Pancino, E., Rejkuba, M., Zoccali, M., & Carrera, R. 2010b, A&A, 524, A44 [NASA ADS] [CrossRef] [EDP Sciences] [Google Scholar]
- Pandey, A. K., Bhatt, B. C., Mahra, H. S., & Sagar, R. 1989, MNRAS, 236, 263 [NASA ADS] [Google Scholar]
- Piatti, A. E. 2012, A&A, 540, A58 [NASA ADS] [CrossRef] [EDP Sciences] [Google Scholar]
- Piatti, A. E. 2013, MNRAS, 430, 2358 [NASA ADS] [CrossRef] [Google Scholar]
- Platais, I., Cudworth, K. M., Kozhurina-Platais, V., et al. 2011, ApJ, 733, L1 [NASA ADS] [CrossRef] [Google Scholar]
- Rubele, S., Kerber, L., & Girardi, L. 2010, MNRAS, 403, 1156 [NASA ADS] [CrossRef] [Google Scholar]
- Rubele, S., Girardi, L., Kozhurina-Platais, V., Goudfrooij, P., & Kerber, L. 2011, MNRAS, 414, 2204 [NASA ADS] [CrossRef] [Google Scholar]
- Rubele, S., Girardi, L., Kozhurina-Platais, V., et al. 2013, MNRAS, 430, 2774 [NASA ADS] [CrossRef] [Google Scholar]
- Sagar, R., Joshi, U. C., & Sinvhal, S. D. 1983, Bull. Astron. Soc. India, 11, 44 [NASA ADS] [Google Scholar]
- Salaris, M., Weiss, A., & Percival, S. M. 2004, A&A, 414, 163 [NASA ADS] [CrossRef] [EDP Sciences] [Google Scholar]
- Sbordone, L., Bonifacio, P., Marconi, G., Buonanno, R., & Zaggia, S. 2005, A&A, 437, 905 [NASA ADS] [CrossRef] [EDP Sciences] [Google Scholar]
- Sbordone, L., Bonifacio, P., Buonanno, R., et al. 2007, A&A, 465, 815 [NASA ADS] [CrossRef] [EDP Sciences] [Google Scholar]
- Sestito, P., Bragaglia, A., Randich, S., et al. 2008, A&A, 488, 943 [NASA ADS] [CrossRef] [EDP Sciences] [Google Scholar]
- Smiljanic, R., Gauderon, R., North, P., et al. 2009, A&A, 502, 267 [NASA ADS] [CrossRef] [EDP Sciences] [Google Scholar]
- Smith, G. H., & Norris, J. 1984, AJ, 89, 263 [NASA ADS] [CrossRef] [Google Scholar]
- Smith, V. V., & Suntzeff, N. B. 1987, AJ, 93, 359 [NASA ADS] [CrossRef] [Google Scholar]
- Smith, G. H., Briley, M. M., & Harbeck, D. 2005, AJ, 129, 1589 [NASA ADS] [CrossRef] [Google Scholar]
- Smolinski, J. P., Lee, Y. S., Beers, T. C., et al. 2011, AJ, 141, 89 [NASA ADS] [CrossRef] [Google Scholar]
- Spassova, N. M., & Baev, P. V. 1985, Ap&SS, 112, 111 [NASA ADS] [CrossRef] [Google Scholar]
- Stoughton, C., Lupton, R. H., Bernardi, M., et al. 2002, AJ, 123, 485 [NASA ADS] [CrossRef] [Google Scholar]
- Tautvaišienė, G., Wallerstein, G., Geisler, D., Gonzalez, G., & Charbonnel, C. 2004, AJ, 127, 373 [NASA ADS] [CrossRef] [Google Scholar]
- Tosi, M., Di Fabrizio, L., Bragaglia, A., Carusillo, P. A., & Marconi, G. 2004, MNRAS, 354, 225 [NASA ADS] [CrossRef] [Google Scholar]
- Twarog, B. A., Carraro, G., & Anthony-Twarog, B. J. 2011, ApJ, 727, L7 [NASA ADS] [CrossRef] [Google Scholar]
- Vesperini, E., McMillan, S. L. W., D’Antona, F., & D’Ercole, A. 2010, ApJ, 718, L112 [NASA ADS] [CrossRef] [Google Scholar]
- Walker, A. R., Kunder, A. M., Andreuzzi, G., et al. 2011, MNRAS, 415, 643 [NASA ADS] [CrossRef] [Google Scholar]
- Wu, Z.-Y., Zhou, X., Ma, J., et al. 2007, AJ, 133, 2061 [NASA ADS] [CrossRef] [Google Scholar]
- Yanny, B., Rockosi, C., Newberg, H. J., et al. 2009, AJ, 137, 4377 [NASA ADS] [CrossRef] [Google Scholar]
All Tables
Median uncertainties for each cluster and index and the σ of the Gaussian fit to the generalized histogram of each pseudo-index.
All Figures
|
Fig. 1 Example of two spectra over-plotted, one in grey (3569) and one in black (4751), for two stars in NGC 7789 with different CN band strengths. The top panel shows the wavelength region which includes the CN band at 4142 Å and the CH band at 4300 Å. The wavelength region which contains the CN band at 3839 Å has been plotted in the bottom panel. The windows used to determine the strength of each molecular band have been marked with horizontal arrows, whereas vertical dashed lines show the edges of these windows. |
| In the text | |
|
Fig. 2 Left: spatial distribution of all stars observed by SEGUE (dots) and those with available photometry (light grey) for each cluster. Dashed lines denote the radii used to select cluster members, which are marked as black circles. Right: radial velocity histograms of all stars observed by SEGUE (grey) and those located within the radii used to select cluster members (black). Dashed lines denote the radial velocity limits used (see Table 1). [Fe/H] distributions of stars selected for their radial velocity and [Fe/H] have been plotted in the inset panels with grey and black lines, respectively. |
| In the text | |
|
Fig. 3 Colour−magnitude diagrams of the five clusters in our sample with the location of our target stars: MS (filled circles); RGB (crosses), RC (stars), and discarded stars either from their position in the colour−magnitude diagram or by low signal-to-noise ratio spectra (open circles). The best photometries available in the literature have been used, although this implies different filter combinations since similar quality photometry for all the clusters in our sample is not available in the same bandpasses. |
| In the text | |
|
Fig. 4 Left: run of the strength of the molecular indices of MS stars in NGC 2158 vs. their V magnitudes. A line has been fitted (dashed line) to remove the temperature and gravity dependence and to obtain the corrected pseudo-indices. Right: normal (histogram) and generalized (solid line) distributions of each corrected pseudo-index. Dashed lines are the best single Gaussians fitted to each generalized distribution. Note that the dashed lines fall so closely to the solid lines in all the cases that it is difficult to distinguish them. The residuals between the single Gaussian and the generalized distribution are shown in the inset panels. |
| In the text | |
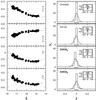 |
Fig. 5 As in Fig. 4 but for NGC 2420. |
| In the text | |
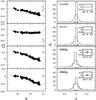 |
Fig. 6 As in Fig. 4 but for NGC 2682. |
| In the text | |
|
Fig. 7 As in Fig. 4 but for RC stars in NGC 7789. In this case the run of each index has been plotted as a function of V − I colours. |
| In the text | |
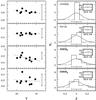 |
Fig. 8 As in Fig. 4 but for Berkeley 29. |
| In the text | |
|
Fig. 9 Age versus MV (as a proxy for mass) for Galactic OCs (triangles) and GCs (filled circles). Clusters in other galaxies have been marked with stars with differing numbers of branches: LMC (four), Small Magellanic Cloud (SMC, five), Sagittarius (six), and Fornax (seven). Clusters for which either multiple sequences in the colour−magnitude diagrams, chemical inhomogeneities, or both have been detected are in green, whereas clusters without either are in red. In magenta are clusters for which there are doubts about the existence of chemical inhomogeneities. Clusters not properly studied are in grey. Clusters studied here are encircled. Lines of constant mass for different metallicities have been superimposed (See text for detail). |
| In the text | |
Current usage metrics show cumulative count of Article Views (full-text article views including HTML views, PDF and ePub downloads, according to the available data) and Abstracts Views on Vision4Press platform.
Data correspond to usage on the plateform after 2015. The current usage metrics is available 48-96 hours after online publication and is updated daily on week days.
Initial download of the metrics may take a while.