Fig. 4
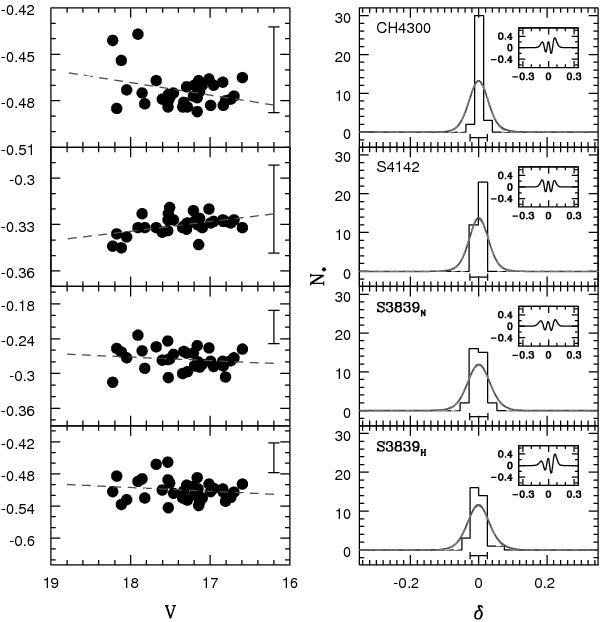
Left: run of the strength of the molecular indices of MS stars in NGC 2158 vs. their V magnitudes. A line has been fitted (dashed line) to remove the temperature and gravity dependence and to obtain the corrected pseudo-indices. Right: normal (histogram) and generalized (solid line) distributions of each corrected pseudo-index. Dashed lines are the best single Gaussians fitted to each generalized distribution. Note that the dashed lines fall so closely to the solid lines in all the cases that it is difficult to distinguish them. The residuals between the single Gaussian and the generalized distribution are shown in the inset panels.
Current usage metrics show cumulative count of Article Views (full-text article views including HTML views, PDF and ePub downloads, according to the available data) and Abstracts Views on Vision4Press platform.
Data correspond to usage on the plateform after 2015. The current usage metrics is available 48-96 hours after online publication and is updated daily on week days.
Initial download of the metrics may take a while.