Fig. 3
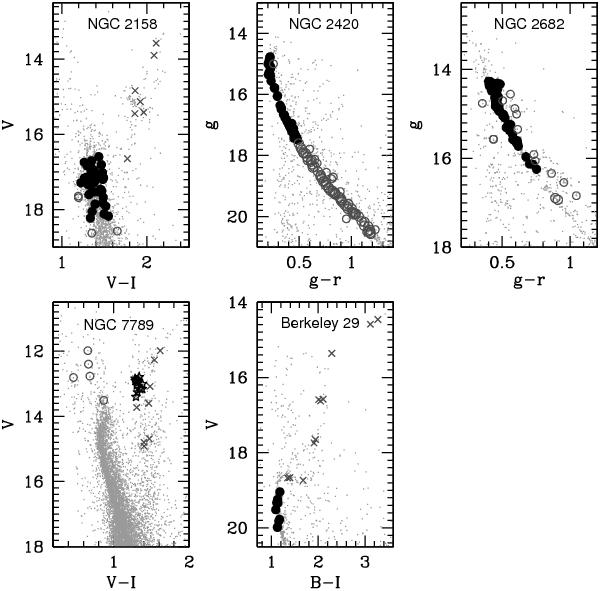
Colour−magnitude diagrams of the five clusters in our sample with the location of our target stars: MS (filled circles); RGB (crosses), RC (stars), and discarded stars either from their position in the colour−magnitude diagram or by low signal-to-noise ratio spectra (open circles). The best photometries available in the literature have been used, although this implies different filter combinations since similar quality photometry for all the clusters in our sample is not available in the same bandpasses.
Current usage metrics show cumulative count of Article Views (full-text article views including HTML views, PDF and ePub downloads, according to the available data) and Abstracts Views on Vision4Press platform.
Data correspond to usage on the plateform after 2015. The current usage metrics is available 48-96 hours after online publication and is updated daily on week days.
Initial download of the metrics may take a while.