Fig. 2
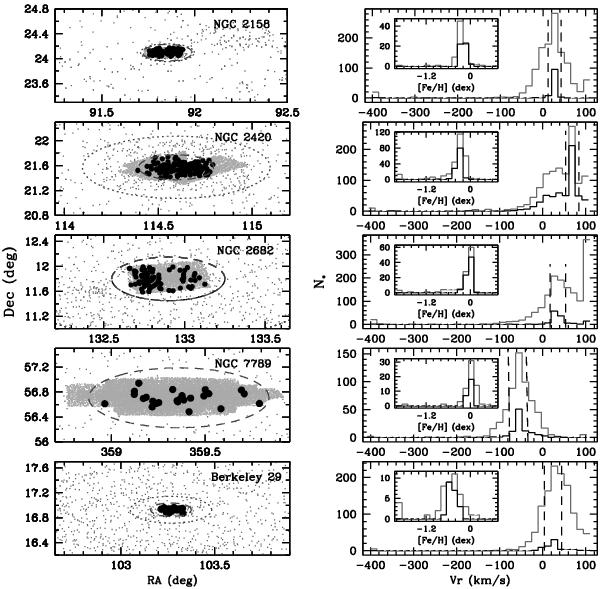
Left: spatial distribution of all stars observed by SEGUE (dots) and those with available photometry (light grey) for each cluster. Dashed lines denote the radii used to select cluster members, which are marked as black circles. Right: radial velocity histograms of all stars observed by SEGUE (grey) and those located within the radii used to select cluster members (black). Dashed lines denote the radial velocity limits used (see Table 1). [Fe/H] distributions of stars selected for their radial velocity and [Fe/H] have been plotted in the inset panels with grey and black lines, respectively.
Current usage metrics show cumulative count of Article Views (full-text article views including HTML views, PDF and ePub downloads, according to the available data) and Abstracts Views on Vision4Press platform.
Data correspond to usage on the plateform after 2015. The current usage metrics is available 48-96 hours after online publication and is updated daily on week days.
Initial download of the metrics may take a while.