Fig. 1
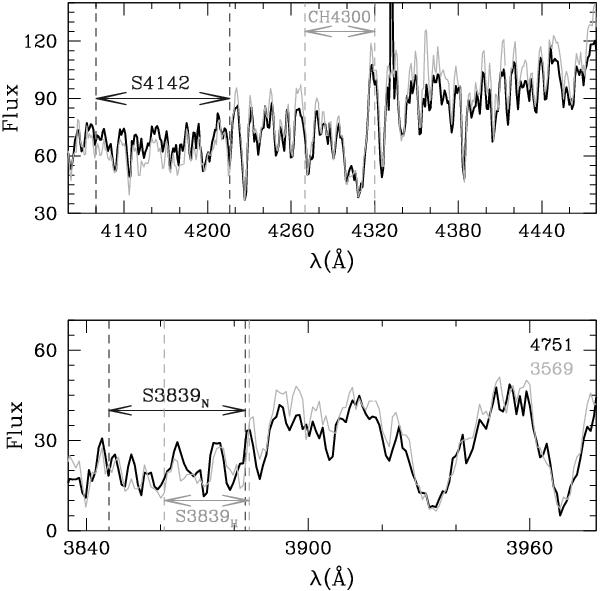
Example of two spectra over-plotted, one in grey (3569) and one in black (4751), for two stars in NGC 7789 with different CN band strengths. The top panel shows the wavelength region which includes the CN band at 4142 Å and the CH band at 4300 Å. The wavelength region which contains the CN band at 3839 Å has been plotted in the bottom panel. The windows used to determine the strength of each molecular band have been marked with horizontal arrows, whereas vertical dashed lines show the edges of these windows.
Current usage metrics show cumulative count of Article Views (full-text article views including HTML views, PDF and ePub downloads, according to the available data) and Abstracts Views on Vision4Press platform.
Data correspond to usage on the plateform after 2015. The current usage metrics is available 48-96 hours after online publication and is updated daily on week days.
Initial download of the metrics may take a while.