| Issue |
A&A
Volume 559, November 2013
|
|
|---|---|---|
| Article Number | A93 | |
| Number of page(s) | 25 | |
| Section | Interstellar and circumstellar matter | |
| DOI | https://doi.org/10.1051/0004-6361/201321683 | |
| Published online | 21 November 2013 | |
HIFISTARS Herschel/HIFI observations of VY Canis Majoris⋆,⋆⋆
Molecular-line inventory of the envelope around the largest known star
1
Observatorio Astronómico Nacional (IGN),
Alfonso XII, 3 y 5,
28014
Madrid,
Spain
e-mail: This email address is being protected from spambots. You need JavaScript enabled to view it.
2
Observatorio Astronómico Nacional (IGN),
PO Box 112, 28803
Alcalá de Henares,
Spain
3
European Space Astronomy Centre, Urb. Villafranca del Castillo, PO
Box 50727, 28080
Madrid,
Spain
4
CAB, INTA-CSIC, Ctra. de Torrejón a Ajalvir, km 4,
28850
Torrejón de Ardoz,
Spain
5
Instituut voor Sterrenkunde, Katholieke Universiteit
Leuven, Celestijnenlaan 200D BUS
2401, 3001
Leuven,
Belgium
6
Max-Planck-Institut für Radioastronomie,
Auf dem Hügel 69, 53121
Bonn,
Germany
7
Sterrenkundig Instituut Anton Pannekoek, University of
Amsterdam, Science Park 904,
1098
Amsterdam, The
Netherlands
8
Department of Astrophysics/IMAPP, Radboud University
Nijmegen, Nijmegen,
The Netherlands
9
Onsala Space Observatory, Dept. of Earth and Space Sciences,
Chalmers University of Technology, 43992
Onsala,
Sweden
10
Harvard-Smithsonian Center for Astrophysics,
Cambridge, MA
02138,
USA
11
The Johns Hopkins University, 3400 North Charles St, Baltimore, MD
21218,
USA
12
N. Copernicus Astronomical Center, Rabiańska 8,
87-100
Toruń,
Poland
13
Netherlands Institute for Space Research,
Sorbonnelaan 2, 3584 CA
Utrecht, The
Netherlands
Received:
11
April
2013
Accepted:
25
September
2013
Abstract
Aims. The study of the molecular gas in the circumstellar envelopes of evolved stars is normally undertaken by observing lines of CO (and other species) in the millimetre-wave domain. In general, the excitation requirements of the observed lines are low at these wavelengths, and therefore these observations predominantly probe the cold outer envelope while studying the warm inner regions of the envelopes normally requires sub-millimetre (sub-mm) and far-infrared (FIR) observational data.
Methods. To gain insight into the physical conditions and kinematics of the warm (100–1000 K) gas around the red hyper-giant VY CMa, we performed sensitive high spectral resolution observations of molecular lines in the sub-mm/FIR using the HIFI instrument of the Herschel Space Observatory. We observed CO, H2O, and other molecular species, sampling excitation energies from a few tens to a few thousand K. These observations are part of the Herschel guaranteed time key program HIFISTARS.
Results. We detected the J = 6–5, J = 10–9, and J = 16–15 lines of 12CO and 13CO at ~100, 300, and 750 K above the ground state (and the 13CO J = 9–8 line). These lines are crucial for improving the modelling of the internal layers of the envelope around VY CMa. We also detected 27 lines of H2O and its isotopomers, and 96 lines of species such as NH3, SiO, SO, SO2 HCN, OH and others, some of them originating from vibrationally excited levels. Three lines were not unambiguously assigned.
Conclusions. Our observations confirm that VY CMa’s envelope must consist of two or more detached components. The molecular excitation in the outer layers is significantly lower than in the inner ones, resulting in strong self-absorbed profiles in molecular lines that are optically thick in this outer envelope, for instance, low-lying lines of H2O. Except for the most abundant species, CO and H2O, most of the molecular emission detected at these sub-mm/FIR wavelengths arise from the central parts of the envelope. The spectrum of VY CMa is very prominent in vibrationally excited lines, which are caused by the strong IR pumping present in the central regions. Compared with envelopes of other massive evolved stars, VY CMa’s emission is particularly strong in these vibrationally excited lines, as well as in the emission from less abundant species such as H13CN, SO, and NH3.
Key words: stars: AGB and post-AGB / stars: mass-loss / stars: individual: VY Canis Majoris / circumstellar matter
Herschel is an ESA space observatory with science instruments provided by European-led Principal Investigator consortia and with important participation from NASA. HIFI is the Herschel Heterodyne Instrument for the Far Infrared.
Appendices A and B are available in electronic form at http://www.aanda.org
Deceased 14 January 2011.
© ESO, 2013
1. Introduction
The very luminous red evolved star VY CMa (M2.5 – M5e Ia; Wallerstein 1958; Humphreys 1974), also known as IRC −30087 and CRL 1111, is one of the most extreme stars in our galaxy. Thanks to trigonometric parallax measurements of H2O and 28SiO masers, the distance to VY CMa is well known, 1.10–1.25 kpc (see Choi et al. 2008; Zhang et al. 2012), resulting in a total luminosity of 3 × 10⁵ L⊙ (Smith et al. 2001). This value is close to the empirical limit for cool evolved stars (Humphreys & Davidson 1994), and therefore VY CMa has been classified as a red hyper-giant (RHG), see de Jager (1998). These accurate distance estimates, in combination with VLTI/AMBER measurements of the angular size of VY CMa, result in a value for the stellar radius that is the highest among well-characterized stars in our galaxy: 1420 ± 120 R⊙ (Wittkowski et al. 2012). Values for its initial mass are more uncertain, ranging from 15 to 50 M⊙ (see Wittkowski et al. 1998; Knapp et al. 1993; Smith et al. 2001; Choi et al. 2008; Wittkowski et al. 2012). VY CMa is also characterized by displaying a huge mass loss, with rate values in the range of 5 × 10⁻⁵ to 10-4 M⊙ yr-1 (Decin et al. 2006), and as high as 2 × 10⁻³ at least during the past 300 yr (see Smith et al. 2009, and references therein); this last value is so high that it is thought that VY CMa might explode as a supernova from its present state in about 105 yr (see Smith et al. 2009).
Owing to its high mass-loss rate, the star is surrounded by a thick circumstellar envelope, which was detected as an optical reflection nebulosity almost a century ago (Perrine 1923), and which has been studied in great detail using the Hubble Space Telescope and ground-based adaptive optics (see Smith et al. 2001; Humphreys et al. 2007, and references therein). This nebulosity is relatively compact, 8′′ × 8′′ at most (even in the mid-IR), but displays much sub-structure. At short wavelengths, the nebula is highly asymmetric, with a much brighter lobe located south of the assumed position of the star. This suggests the existence of a bipolar structure oriented in the north-south direction, the south lobe pointing towards us (see Herbig 1970, for example). Due to the large amount of dust in the envelope, the star itself is hardly visible in the optical, and most of its luminosity is re-radiated in the mid-IR and at longer wavelengths. This and the high luminosity of the source makes VY CMa one of the brightest IR sources in the sky.
The envelope around VY CMa has a very rich molecular variety. In the centimetre- and millimetre-wave range, VY CMa has been known for many years to exhibit strong maser emission in the three classical circumstellar maser species: OH, H2O, and 28SiO. In particular, VY CMa is the strongest emitter of highly excited 28SiO (v > 2) and H2O (v2 ≥ 1) masers (see e.g. Cernicharo et al. 1993; Menten et al. 2006). At these wavelengths, however, the strength of the thermal molecular emission of VY CMa’s envelope is not outstanding, probably due to its large distance and small extent, which led to little interest in the object. This situation has changed drastically in the past half decade, when the results of sensitive spectral surveys in millimetre, sub-millimetre (sub-mm), and far-IR (FIR) ranges were published, from which a wealth of molecular lines from about two dozen species have been identified. Since then, this source has become the main target of the search of new molecular species in O-rich circumstellar environments.
Using the ISO Short Wavelength Spectrometer, Neufeld et al. (1999) discovered that the FIR spectrum of VY CMa is rich in spectral features that are caused by water vapour. Subsequently, Polehampton et al. (2010) studied VY CMa at longer wavelengths with the ISO Long Wavelength Spectrometer, finding that it is also dominated by strong lines of H2O, and concluding that this is the most abundant molecular species after H2 in its circumstellar envelope. In addition to H2O, CO, and OH, these authors also reported the identification of lines from less common species such as NH3, and tentatively H3O+. In the same year, Royer et al. (2010) published the Herschel PACS and SPIRE full spectral scan (55 to 672 μm wavelength range). These more sensitive observations confirmed that the FIR and sub-mm spectrum of VY CMa is dominated by H2O lines, which are responsible for nearly half of the 930 emission lines identified in this work. In addition to H2O, lines of CO, CN, CS, SO, NH3, OH, SiO, SiS, SO2, H2S, and H3O+ (and of some of their isotopomers) are also detected in the spectrum, in spite of the relatively poor spectral resolution. From a preliminary analysis of the H2O spectrum, Royer and collaborators concluded that the fractional abundance of this species (w.r.t. the total abundance of hydrogen) is very high, 3 × 10⁻⁴. They also found a low ortho-to-para abundance ratio of ~1.3:1, which would support the hypothesis that non-equilibrium chemical processes control the formation of H2O in this envelope. Meanwhile, Tenenbaum et al. (2010b; but see also Ziurys et al. 2007 and 2009; Tenenbaum & Ziurys 2009 and 2010; Tenenbaum et al. 2010a) presented the results of a full-scan survey in the 215–285 GHz range, conducted with the Arizona Radio Obseratory’s 10 m diameter Submillimeter Telescope1 on Mt. Graham (ARO-10 m SMT). This survey yielded the detection of ten more new species in the envelope of VY CMa, namely HCN, HNC, HCO+, CN, NS, PN, PO, NaCl, AlO, and AlOH. These studies will soon be complemented with the results from the full spectral surveys that have been or are being performed with Herschel/HIFI and the IRAM 30 m telescope in all the available bands of these two instruments, and with the Submillimeter Array (SMA) in the 280–355 GHz (~0.9 mm) frequency range (see Kamiński et al. 2013). Altogether, these works have revealed, and will continue to reveal, the chemical richness and complexity that can be present in the circumstellar envelopes of cool, high mass-loss O-rich stars.
A proper understanding of the chemical characteristics of the circumstellar envelope of this unique source necessarily requires a prior good knowledge of the main physical conditions in the envelope. For the cool layers, this can be attained from the ground by means of low-J rotational lines of CO and other abundant species. However, to gain insight into the deep warm layers where most of the molecular species are formed, we need to observe high-J lines that in general are not or not easily accessible for ground-based telescopes. Moreover, for O-rich environments, the expected high H2O abundances make this species the major coolant for the gas phase, and therefore knowing the distribution and excitation of H2O is crucial for determining the temperature of the molecular gas in general. Yet, it is important to observe these molecular lines with very high spectral resolution to adequately probe the velocity field in the envelope. All these observational needs are fully met by the HIFI instrument on-board the Herschel Space Observatory. Here we present new Herschel/HIFI observations of VY CMa. Observational and data reduction procedures are detailed in Sect. 2. In Sect. 3 and the appendices, we discuss the main observational results. The conclusions are presented in Sect. 4.
Telescope characteristics and main observational parameters.
2. Observations and data reduction
The observations we present in this paper were obtained with the Herschel Space Observatory (Pilbratt et al. 2010), using the Heterodyne Instrument for the Far Infrared (HIFI, de Graauw et al. 2010). This data set is part of the results obtained by the guaranteed time key program HIFISTARS, which is devoted to the study of the warm gas and water vapour contents of the molecular envelopes around evolved stars. The main target lines of the HIFISTARS project were the J = 6–5, 10–9, and 16–15 transitions of 12CO and 13CO, and several lines of ortho- and para-H2O sampling a wide range of line-strengths and excitation energies, including vibrationally excited states. In addition, some other lines were observed simultaneously, thanks to the large instantaneous bandwidth coverage of the HIFI receivers. We observed 16 different frequency settings for VY CMa. In the naming adopted in the project, these spectral setups are, in order of increasing local oscillator (LO) frequency, settings 14, 13, 12, 17, 11, 10, 09, 08, 07, 06, 05, 04, 03, 19, 16, and 01; their main observational parameters are listed in Table 1.
The observations were all performed using the two orthogonal linearly polarized receivers available for each band, named H and V (horizontal and vertical) for their mutually perpendicular orientations. These receivers work in double side-band mode (DSB), which doubles the instantaneous sky frequency coverage of the HIFI instrument: 4 plus 4 GHz for the superconductor-insulator-superconductor (SIS) receivers of bands 1 to 5, and 2.6 plus 2.6 GHz for the hot-electron bolometer (HEB) receivers of band 7. The observations were all performed in the dual-beam switching (DBS) mode. In this mode, the HIFI internal steering mirror chops between the source position and two (expected to be) emission-free positions located 3′ at either side of the science target. The telescope alternately locates the source in either of the two chopped beams (a and b), providing a double-difference calibration scheme, (ONa −OFFb)−(OFFa −ONb), which allows a more efficient cancellation of the residual baseline and optical standing waves in the spectra (see Roelfsema et al. 2012, for additional details). In our program, the DBS procedure worked well except for band 7, where strong ripples (generated by electrical standing waves) are often found in the averaged spectra, especially in the case of the V-receiver. The HIFI data shown here were taken using the wide-band spectrometer (WBS), an acousto-optical spectrometer that provides full coverage of the whole instantaneous IF band in the two available orthogonal receivers, with an effective spectral resolution slightly varying across the band, with a mean value of 1.1 MHz. This spectrometer is made of units with bandwidths slightly wider than 1 GHz, and therefore four/three units per SIS/HEB receiver are needed to cover the full band.
The data were retrieved from the Herschel Science Archive and were reprocessed using a modified version of the standard HIFI pipeline using HIPE2. This customized level-2 pipeline provides as final result individual double-difference elementary integrations without performing the final time-averaging, but stitching the three or four used WBS sub-bands together3. Later on, these spectra were exported to CLASS4 using the hiClass tool within HIPE for a more detailed inspection and flagging of data with noticeable ripple residuals. Time-averaging was also performed in CLASS, as well as baseline removal. Finally, spectra from the H and V receivers were compared and averaged together, as the differences found between the two receivers were always smaller than the calibration uncertainties.
In general, the data presented no problems and did not need a lot of flagging, except for the settings observed using band 7 (see Table 1). All these settings presented severe residual ripples whose intensity varied from sub-scan to sub-scan. A semi-automated procedure was designed in CLASS to detect and remove the sub-scans in which the ripples were more severe. The application of this procedure normally results in the rejection of 30% to 50% of the non-averaged spectra, which produces a final spectrum slightly noisier, but with a more reliable baseline, since the standing waves are largely suppressed. Some instrumental features affecting the baseline were also detected in settings 09, 10, and 11, which are also largely suppressed by removing the most affected sub-scans.
The original data were oversampled to a uniform channel spacing of 0.5 MHz, but we smoothed all spectra down to a velocity resolution of about 1 km s-1. The data were re-calibrated into (Rayleigh-Jeans equivalent) main-beam temperatures (Tmb) adopting the latest available values for the telescope and main beam efficiencies (Roelfsema et al. 2012). In all cases we assumed a side-band gain ratio of one. A summary of these telescope characteristics, including the total observational uncertainty budget, is given in Table 1.
3. HIFI results
The final results of the HIFISTARS observations of VY CMa are presented in Figs. B.1 and B.2, where we show the full bandwidth observed in each of the settings using the WBS. The original spectral resolution was degraded down to about 1 km s-1 by averaging to the nearest integer number of channels, and a baseline was removed. Because the receivers work in DSB mode, each spectral feature has two possible values for its rest frequency, one if the emission enters the receiver via the LSB, and another if it does via the USB. In Figs. B.1 and B.2 we therefore plotted both frequency axes. In all cases, frequency scales and line identifications are made assuming a systemic velocity for the source of 22 km s-1 w.r.t. the LSR frame. Lines from the LSB and USB, marked in red and blue, are labelled on the lower/upper x-axis of each panel. For the three lines that remain unidentified or unassigned, marked in green, we give labels for the two (LSB/USB) possible rest frequencies.
We detected 34 lines of CO and H2O (including their isotopomers), 96 additional lines of 14 other species, and 3 unidentified lines. Therefore, in the 114 GHz covered by the observations (in both upper and lower side-bands), we detected a total 133 spectral lines, resulting in a mean line density of 1.17 lines per GHz. In Tables 2, 3, A.1, and A.2, we give the main observational parameters of the detected lines. We list the species and transition names, the energy of the upper state above the ground level of the species, the rest frequency found in the spectral line catalogues, the name of the HIFISTARS setting and side-band in which the line was observed, the root mean square (rms) value for the given spectral resolution, the peak intensity, the integrated area, and the velocity range over which the line’s emission was integrated (in the cases where this applies). For unblended well-detected lines, peak and area were computed directly from the observational data. For blended lines or spectral features for which the signal-to-noise ratio (S/N) is modest, we fitted Gaussian profiles to the spectra, and we give the peak and area resulting from these fits. In the case of blended lines, we simultaneously fitted as many Gaussian profiles – usually two, but sometimes up to four – as evident lines appeared in the blended profile. The results from these fits, as well as the resulting total composite profile, can be seen in the figures of the individual lines (see next paragraph). Parameters for unidentified features are listed in Table A.3.
Spectral-line results for carbon monoxide and water vapour.
Spectral-line results for ammonia, hydrogen sulphide, hydroxyl, and silicon monoxide.
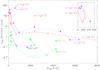 |
Fig. 1 Rotational diagrams for species discussed in Sect. 3 with emission from vibrationally excited levels: for H2O and 28SiO, central (c) and red-HEVW (r) components; for 29SiO and 30SiO, central component (c) only. Solid lines join upper levels in the same vibrational state, while dashed lines join upper levels in different vibrational states. 28SiO and H2O maser lines, indicated with an asterisk (*), are connected to their respective diagrams by vertical dotted lines. |
Individual plots for the different-well detected lines are presented in Figs. 3–10 and A.2–A.5. In these individual line plots, the horizontal scale is given in LSR velocities assuming the rest frequency quoted in the tables. In many cases, some other lines, close in frequency or from the other side-band, can be seen in the plots. To avoid confusion, the spectral line we refer to is plotted in the centre of the panel, and the grey area below the histogram shows the velocity range considered when computing its integrated intensity as given in Tables 2, 3, A.1, and A.2. In the case of line blends, we also plot the results of the multi-line Gaussian fit we used to separate the emission from the different lines, as well as the resulting composite spectrum. Here the grey area also shows the contribution to the profile of the spectral line shown in the panel. Species and line names, rest frequency, setting and side-band, as well as the HPBW of the telescope at the corresponding frequency are also given in each panel. To facilitate the comparison between the different line profiles, vertical red dashed lines mark the assumed systemic velocity and the central velocities of the two high expansion velocity components (see next paragraphs).
We only made observations pointed at the central position of the star: J2000 RA
07h22m58 33, Dec
−25°46′03
33, Dec
−25°46′03 2 (see Zhang et al. 2012). Therefore, for emitting sizes larger
than or comparable with the beam size of the telescope, some flux is missed. In the optical
and IR, the nebula around VY CMa is not larger than
8′′ in diameter (see Sect. 1). From the interferometric
maps of lines of CO and other molecules (Muller et al.
2007; Verheyen 2011; Fu et al. 2012), it is found that the molecular emission is also smaller
than 8′′. In these cases, however, it can be argued that any more extended component could
be resolved out. We investigated the existence of such an extended component (10′′ in
diameter or larger) by comparing single-dish data from radio telescopes of different beam
sizes. We compared the 12CO J = 2–1 spectrum from VY CMa observed at the IRAM 30 m (unpublished observations
by some of us) and JCMT 15 m (Kemper et al. 2003)
telescopes, with HPBWs of 12′′ and 197, respectively.
When comparing these two spectra, we found an IRAM 30 m-to-JCMT 15 m flux ratio of 2.1,
except for the velocity range 12–22 km s-1, where we obtained values between 1.8
and 2.1. If we assume that these ratios are only due to the different beam dilution factors,
we derive a FWHM size for the emitting region of ~8′′ for the 2.1 ratio, while the
1.8 value can be explained if the size of the source is a large as
~125. We note that this
analysis is affected by the uncertainties in the absolute calibration of both telescopes,
but these sizes are compatible with existing images of the nebula. Still, the existence of a
structure larger than ~8′′ at moderate blue-shifted velocities (between
12–22 km s-1) agrees with the lost flux at these velocities noted by Muller et al. (2007) in their interferometric
observations. All these estimates agree with other results obtained from single-dish studies
from ground-based telescopes such as those by Ziurys et al.
(2007, 2009). Our very crude size estimates
should be taken as upper limits, because they are based on a low-energy transition, with
Eupp/k of just 17 K, of a very abundant and
easily thermalizable molecule. For the observations presented here, we note that the HPBW of
the telescope is larger than these estimated sizes, and/or the excitation energies of the
transitions are considerably higher (see Tables 1 to
3, and A.1
to A.3). Hence no significant amount of lost flux is
expected in our data.
2 (see Zhang et al. 2012). Therefore, for emitting sizes larger
than or comparable with the beam size of the telescope, some flux is missed. In the optical
and IR, the nebula around VY CMa is not larger than
8′′ in diameter (see Sect. 1). From the interferometric
maps of lines of CO and other molecules (Muller et al.
2007; Verheyen 2011; Fu et al. 2012), it is found that the molecular emission is also smaller
than 8′′. In these cases, however, it can be argued that any more extended component could
be resolved out. We investigated the existence of such an extended component (10′′ in
diameter or larger) by comparing single-dish data from radio telescopes of different beam
sizes. We compared the 12CO J = 2–1 spectrum from VY CMa observed at the IRAM 30 m (unpublished observations
by some of us) and JCMT 15 m (Kemper et al. 2003)
telescopes, with HPBWs of 12′′ and 197, respectively.
When comparing these two spectra, we found an IRAM 30 m-to-JCMT 15 m flux ratio of 2.1,
except for the velocity range 12–22 km s-1, where we obtained values between 1.8
and 2.1. If we assume that these ratios are only due to the different beam dilution factors,
we derive a FWHM size for the emitting region of ~8′′ for the 2.1 ratio, while the
1.8 value can be explained if the size of the source is a large as
~125. We note that this
analysis is affected by the uncertainties in the absolute calibration of both telescopes,
but these sizes are compatible with existing images of the nebula. Still, the existence of a
structure larger than ~8′′ at moderate blue-shifted velocities (between
12–22 km s-1) agrees with the lost flux at these velocities noted by Muller et al. (2007) in their interferometric
observations. All these estimates agree with other results obtained from single-dish studies
from ground-based telescopes such as those by Ziurys et al.
(2007, 2009). Our very crude size estimates
should be taken as upper limits, because they are based on a low-energy transition, with
Eupp/k of just 17 K, of a very abundant and
easily thermalizable molecule. For the observations presented here, we note that the HPBW of
the telescope is larger than these estimated sizes, and/or the excitation energies of the
transitions are considerably higher (see Tables 1 to
3, and A.1
to A.3). Hence no significant amount of lost flux is
expected in our data.
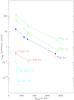 |
Fig. 2 Rotational diagrams for species discussed in Sect. 3 with no emission from vibrationally excited levels: for 12CO, central (c) and red-HEVW (r) components; for 13CO, NH3, and H2S, central component (c) only. Upper limits are marked with downward arrows. |
Because the envelope around VY CMa is peculiar (it is not dominated by a constant mass-loss wind that isotropically expands at constant velocity), the observed line profiles differ from those typical of circumstellar envelopes. VY CMa’s molecular lines are very often characterized by up to three components: a central component close to the systemic velocity of 22 km s-1 and two high expansion velocity winds (HEVWs) placed symmetrically w.r.t. the central one at ~22 ± 26.2 km s-1, that is, approximately at −4.2 and 48.2 km s-1. This profile decomposition was first noted by Muller et al. (2007) and Ziurys et al. (2007) and has been systematically used for the analysis of the spectral lines of VY CMa since, although some authors have identified up to four components in some cases (Fu et al. 2012). We refer to these three components as the blue-HEVW, the central or systemic component, and the red-HEVW. Some lines exhibit all three components, others only the central one, and in some others the emission in the HEVWs is much stronger than that of the central component. No lines match this latter case in our survey, but some good examples can be found in the literature, for instance, the SO, SO2, and HNC lines presented in Ziurys et al. (2007), Tenenbaum et al. (2010b), and references therein, many of which are emitted from levels with lower energies above the ground than the lines detected by us.
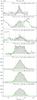 |
Fig. 3 Results for 12CO and 13CO from HIFISTARS observations. Line name, rest frequency (GHz), setting and side-band in which the line has been observed, and HPBW of the telescope at the frequency are also given. The grey area below the intensity histogram indicates the integrated line intensity quoted in Table 2. The horizontal axis gives the Doppler velocity for the adopted rest frequency. The intensities are given in Tmb scale. The vertical dashed lines mark the velocities adopted for the central and HEVW components. The green lines show Gaussian fits either for the HEVW and main components or for blended lines, and their composite profile. See Sects. 3 and 3.1 for more details. Labels for other lines in the spectra are also given in the cases of blended lines. |
We adopted this component splitting in our work and tried to identify the contribution from
these three components by fitting the spectra of some lines with three Gaussian shapes at
fixed LSR velocities of − 4.2, 22, and 48.2 km s-1. To facilitate the fitting, we
also imposed that the widths of the two HEVWs were the same. We note that at lower
frequencies, particularly in lines that are dominated by the HEVW components like those of
the species mentioned before, the width of the red-HEVW is noticeably broader than that of
the blue counterpart (see e.g. Figs. 1 and 3 in Tenenbaum et al.
2010b). However, this seems not to be our case. We see no indications of such a
large difference between the red- and blue-HEVW widths in our spectra. For the few cases in
which our lines have a high S/N and are free from blending of other lines, namely the three
12CO lines and the J = 6–5 line of 13CO in Fig.
3, the
JK =  –
– of
NH3 and the OH lines in Fig. 8, and the
J = 7–6 line of HCN in Fig. A.5, we
tried to fit our data by allowing the widths of the two HEVWs to vary independently, which
resulted in small differences, and the red-HEVW was not always the widest of the two.
Therefore, we decided to leave just five free parameters in the fitting procedure: the
intensities of the three components, the width of the central component, and the width of
the two HEVW components. We did not use this multi-component approach in the cases where the
S/N was low, when there was severe line blending (as the fitting of more than three/four
components would have become very uncertain), and when the observed line profile clearly
deviated from this triple-peaked template, as is the case of maser lines. Separating the
molecular emission in these components allowed us to investigate their origin by studying
their differing excitations. Some authors have argued that the HEVWs, and in general the
high-velocity emission, arise from a wide-opening bipolar flow, whereas the emission from
the central mid-velocity component is due to a slower expanding isotropic envelope (Muller et al. 2007; Ziurys et al. 2007; Fu et al. 2012).
However, other authors have tried to reproduce VY CMa’s profiles using fully isotropic models consisting of multiple shells
with different mass-loss rates (Decin et al. 2006).
of
NH3 and the OH lines in Fig. 8, and the
J = 7–6 line of HCN in Fig. A.5, we
tried to fit our data by allowing the widths of the two HEVWs to vary independently, which
resulted in small differences, and the red-HEVW was not always the widest of the two.
Therefore, we decided to leave just five free parameters in the fitting procedure: the
intensities of the three components, the width of the central component, and the width of
the two HEVW components. We did not use this multi-component approach in the cases where the
S/N was low, when there was severe line blending (as the fitting of more than three/four
components would have become very uncertain), and when the observed line profile clearly
deviated from this triple-peaked template, as is the case of maser lines. Separating the
molecular emission in these components allowed us to investigate their origin by studying
their differing excitations. Some authors have argued that the HEVWs, and in general the
high-velocity emission, arise from a wide-opening bipolar flow, whereas the emission from
the central mid-velocity component is due to a slower expanding isotropic envelope (Muller et al. 2007; Ziurys et al. 2007; Fu et al. 2012).
However, other authors have tried to reproduce VY CMa’s profiles using fully isotropic models consisting of multiple shells
with different mass-loss rates (Decin et al. 2006).
We built rotation diagrams to readily obtain estimates for the excitation conditions of the different molecules and line components, but also to help in the line identification process. In these diagrams we computed the relative population of the upper levels, xupp, assuming that the lines are optically thin as well as a constant small size (≪12″) for the emitting region; see Eq. (23) in Goldsmith & Langer (1999). Although these assumptions are not always valid, the resulting diagrams still provided some useful information on the general trend of the excitation of a species. We inspected these rotational diagrams for the three components separately. Plots of these rotational diagrams can be seen in Figs. 1, 2, and A.1. From these diagrams, it is clear that the rotational temperature varies with the excitation energy of the lines (more highly excited lines tend to show higher rotational temperatures), as is expected in a medium with a steep temperature gradient.
In the following subsections we describe the main observational results for the most relevant species: CO, H2O, NH3, H2S, and OH, and SiO. The other detected species and unassigned features are discussed in detail in Appendix A.
3.1. Carbon monoxide (CO)
The 12CO and 13CO results are presented in Fig. 3 and Tables 2 and A.4. We detected all the v = 0 lines that we observed: the 12CO J = 6–5, J = 10–9, and J = 16–15, and the 13CO J = 6–5, J = 9–8, J = 10–9, and J = 16–15. Two vibrationally excited lines of 12CO, the J = 5–4 and J = 15–14 of v = 1 were also observed, but were not detected; the corresponding upper limits provide no significant constraints on the excitation of these v = 1 states. We did not detect the J = 6–5 line of C18O, which has been detected in other O-rich sources in HIFISTARS (see Bujarrabal et al. 2012; Justtanont et al. 2012); the obtained upper limit for the C18O-to-13CO J = 6–5 intensity ratio is consistent with the values for the O-rich stars detected in C18O (≲0.1, see Justtanont et al. 2012).
The 12CO spectra seen by HIFI are very different from those at lower frequencies and excitation energies (J = 3–2 and below, see e.g. Kemper et al. 2003; De Beck et al. 2010). Although we were able to identify the three classical components in the spectra, even in the J = 6–5 line the emission is highly dominated by the central component. This pre-eminence increases as we move up the rotational ladder: while in the J = 6–5 line the central-to-HEVW peak ratio is about 3, and the two HEVWs represent 24% of the total emission, in the J = 16–15 transition this peak ratio is about 5, and the HEVW emission only accounts for 16% of the total emission. The only spectrum in which the triple-peaked shape is clearly seen is the 13CO J = 6–5, where the central-to-HEVW peak ratio is only 2. In fact, this spectrum resembles very much those of the J = 2–1 and J = 3–2 12CO lines. Although we did not try to separate the emission from the three components in the other 13CO spectra (because the J = 9–8 and J = 10–9 lines are blended and the J = 16–15 line is noisy), the contribution of the HEVWs in these lines is minor. In summary, it is evident that the excitation of CO in the HEVWs is lower than in the central component, especially for 13CO.
In spite of the different opacities expected for the two CO isotopic substitutions, the rotational temperature diagrams (see Fig. 2) give a similar excitation for the two species. Data for the main central component yield values between 120 and 210 K for 12CO, and just 10 K less for 13CO. As expected, when we examine the rotational diagram for the HEVW components of 12CO, we derive lower (but not very different) temperatures, 90 to 170 K. All the CO profiles are quite symmetric; for example, the blue-to-red HEVW intensity ratio is between 0.77 and 0.81 for 12CO, while for 13CO we obtain a value of 1.29. This means that the opacities of the CO lines in the HEVW components cannot be very high, since otherwise we should have detected some self-absorption in the red part of the spectra, because the temperature and velocity gradients in the envelope.
3.2. Water vapour (H2O)
VY CMa HIFISTARS results for water vapour are
shown in Figs. 4 to 7, and in Tables 2 and A.4. In total we have detected 27 water lines. Seven
lines of ortho-H2O, six lines of para-H2O, two lines of both
ortho-H O
and para-HO,
and one line of ortho-H
O
and para-HO,
and one line of ortho-H O
and para-HO
each, all from the ground-vibrational state, and eight lines of H2O from
several vibrationally excited states. Frequencies of several HDO transitions were also
within the observed bands but, as expected, no HDO line was detected. We note the upper
limit obtained the for
JKa,Kc
= 31,2–30,3 of HDO, which is about five to seven times lower than
the intensities measured for the same transition of
HO
and HO
(see Table 2).
O
and para-HO
each, all from the ground-vibrational state, and eight lines of H2O from
several vibrationally excited states. Frequencies of several HDO transitions were also
within the observed bands but, as expected, no HDO line was detected. We note the upper
limit obtained the for
JKa,Kc
= 31,2–30,3 of HDO, which is about five to seven times lower than
the intensities measured for the same transition of
HO
and HO
(see Table 2).
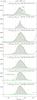 |
Fig. 4 Same as Fig. 3 for the detected v = 0 lines of ortho-H2O. Note the distinctive profile of the JKa,Kc = 53,2–44,1 maser line. The location of the undetected JKa,Kc = 53,3–60,6 line of para-H2O is also indicated. |
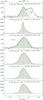 |
Fig. 5 Same as Fig. 3 for the detected v = 0 lines of para-H2O. Note the distinctive profile of the JKa,Kc = 52,4–43,1 maser line. |
For ortho- and para-H2O, we detected all the observed transitions with high line-strengths (ΔJ = 0, ±1 with ΔKa,ΔKc = ±1) from the ground-vibrational state. We also detected the intrinsically weaker (ΔKc = ±3) 52,4–43,1 transition of para-H2O, but its intensity and profile show that it is a maser (Figs. 5 and 1), as is normally the case for the other low line-strength v = 0 transitions of water detected so far. We also detected maser emission from the (intrinsically strong) JKa,Kc = 53,2–44,1 transition of ortho-H2O (Harwit et al. 2010). The highest excitation energy for these ground-vibrational transitions is the nearly 1000 K of the upper level of the JKa,Kc = 63,3–62,4 line of para-H2O (see Table. 2). We note that we did not detect the JKa,Kc = 53,3–60,6 line of para-H2O, which has been observed in other O-rich envelopes in HIFISTARS (Justtanont et al. 2012), the reason being that for VY CMa this transition blends with the much stronger JKa,Kc = 30,3–21,2 line due to the broad linewidths (see Fig. 4).
The profiles of the lines of ortho- and para-H2O, shown in Figs. 4 and 5, are not triple-peaked, but they can be decomposed into the same three components. We did not attempt this decomposition for the 53,2–44,1 (at 620 GHz) and 52,4–43,1 (at 970 GHz) lines because they are masers, nor for the 53,2–52,3 and 63,3–62,4 lines because they are blended. As for CO, the importance of the HEVW components decreases with the excitation of the line. The blue-HEVW component is always found in absorption, whereas the red one is always found in emission. This asymmetry reflects the high opacity of the water lines in general, and that the H2O excitation in the HEVWs is significantly lower than in the central component. If we inspect the rotational diagrams for the central component of the two spin isomers (Fig. 1), we realize that interpreting this plot is more complex than in the case of linear molecules, because the line-strength, level multiplicity, beam dilution, and frequency of the transitions do not monotonically increase with the excitation energy of the levels. However, we can estimate a rotation temperature of about 200 K for both ortho- and para-H2O. Comparing the plots for the two spin isomers, the para-H2O points lie about a factor 3–5 above the ortho points if we assume an ortho-to-para abundance ratio of 3:1. Although this value is affected by the probably high opacity of the lines and the complex excitation of the molecule, the result suggests that the true ortho-to-para ratio must be lower than 3 (see also Royer et al. 2010), and hence that water vapour is formed under non-equilibrium chemical conditions. The result of inspecting the rotational diagram for the red-HEVW component is less clear, but suggests a temperature as low as 100 K.
We systematically searched for a detection of water lines from its four lowest vibrationally excited states v2 = 1, v2 = 2, v1 = 1, and v3 = 1 at 2294, 4598, 5262, and 5404 K above the ground; more than 30 of these lines lie within the observed frequency ranges. We were only able to identify the emission from seven lines, see Table 2: four lines from the v2 = 1 state, and one line for each of the other three vibrationally excited states listed before. We also tentatively assigned the feature at 1194.829 GHz (setting 05 USB, see Fig. B.2) to the 31,2–30,3 line of the v1,2 = 1,1 state with Eupp/k of 7749 K, which holds the excitation record for all species in our survey. We only detected vibrationally excited lines with Einstein-A coefficients higher than 10-2 s-1, except for the v2 = 1 JKa,Kc = 11,0–10,1 and 82,7–73,4 lines at 658 and 968 GHz. The 658 GHz line is a maser (Menten & Young 1995), and shows the highest peak flux in our spectral survey. The profile of the 31,2–30,3 line of the v1,2 = 1,1 state is also suggestive of maser amplification. The profiles and intensities of the other six lines are consistent with thermal emission and only display the central component at 22 km s-1. We did not detect the v3 = 1 30,3–21,2 line, which was observed at the same time as the v3 = 1 63,3–62,4 and should have a similar intensity; for this reason and the low S/N, the detection of this latter line is considered tentative. The remaining non-detected vibrationally excited lines of H2O do not provide significant constraints on the excitation of these levels. We note that the 658 and 970 GHz maser lines are remarkably smooth and do not show narrow (~1 km s-1 wide) spikes like the strong 22.2 GHz ortho-H2O v = 0 61,6–52,3 maser line or strong 28SiO maser lines. (The 620 GHz v = 0 53,2–44,1, maser line shows a few narrow features.) In the first detection paper of the 658 GHz line, Menten & Young (1995) argued that the greater smoothness of this line’s profile compared with that of the 22.2 GHz maser, arise because the 658 GHz maser is saturated while the 22 GHz is not.
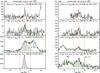 |
Fig. 6 Same as Fig. 3 for the detected lines of vibrationally excited water. Note the narrow profile of the v2 = 1 JKa,Kc = 11,0–10,1 line in the bottom-left panel, indicating its maser origin. This may also be the case of the v1,2 = 1,1 JKa,Kc = 31,2–30,3 line in the top-left panel. |
The rotational diagrams of vibrationally excited H2O are shown in Fig. 1. Excluding maser lines, we only detected three excited transitions of ortho-H2O and four lines of para-H2O, but they mostly originate from different vibrationally excited states. Therefore we can hardly investigate the rotational temperatures in the vibrationally excited ladders: we only derive an excitation temperature of 3000 K between the two thermal v2 = 1 lines of ortho-H2O. However, we can study the relative excitation between the different vibrationally excited states, for which we derive excitation temperatures between 1500 and 3000 K. These values are much higher than those derived for the rotational levels of the ground-vibrational state (see before), suggesting that the population of the vibrational excited levels is mostly due to IR pumping, at 6.2 and 2.7 μm, similar to the cases of other species such as SiO (Sect. 3.4) and SO (Sect. A.1).
For the rare oxygen isotopic substitutions of water,
HO
and HO,
we only detected lines from their ground-vibrational levels with
Eupp/k below 250 K. Several lines with
excitation energies of about 500 K are also present in the observed bands, but they happen
to blend with other (stronger) lines, and therefore it is difficult to tell whether they
are detected. However, we did not detect the 53,2–44,1 line of any
of the two species, whose upper level is at more than 700 K above the ground. Neither did
we detect the v2 = 1 11,0–10,1 line of
ortho-HO.
Among the six detected lines (see Fig. 7), we were
able to identify the triple profile structure only in the lowest-energy line of para-water
(11,1–00,0) for both HO
and HO.
As was also the case for the main isotope, the line is very asymmetric, but here the
absorption due to the blue-HEVW is so deep that the flux is below the continuum level, for
which we measured a value of 70–100 mK at these frequencies. These P-Cygni profiles were
previously observed by Neufeld et al. (1999) in the
main isotopomer in the three cases in which the line shape was resolved in their ISO
observations, those of the
JKa,Kc
= 72,5–61,6, 44,1–31,2, and
43,2–30,3 transitions, with
Eupp/k at 1126, 702, 550 K, respectively.
Assuming that the continuum level detected around 1100 GHz has an extent similar to the
HO
and HO
molecules responsible for the P-Cygni profiles, we conclude that the opacity in the
JKa,Kc
= 11,1–00,0 line of both species must be ≳1, and that the excitation
of the blue-HEVW must be significantly lower than the true dust brightness temperature,
which is about 40 K for a source size of 1′′.
The rotational diagrams for the central component do not give a reliable estimate of the
excitation temperature. We only have two lines per species at most, so we cannot
distinguish between general trends and peculiarities in the excitation of the individual
lines. Taking all transitions together, we see that the abundances of
HO
and HO
are very similar and that again an ortho-to-para abundance ratio lower than 3:1 fits the
data better. Compared with the main isotopologue, the lines are 10 to 20 times weaker.
This is most likely due to the high opacity of the H2O lines, but note that the
opacity of the HO
and HO
cannot be negligible, as discussed above.
3.3. Other hydrides
3.3.1. Ammonia (NH3)
We observed four rotational lines of NH3, two lines of the ortho
(JK =
– and
 –
– ) and two
lines of the para (JK =
) and two
lines of the para (JK =
 –
– and
and
 –
– ) species.
These results are presented in Fig. 8. The results
of the JK =
– have
already been published by Menten et al. (2010).
The profile of this line is somehow unique in our survey because it is slightly
U-shaped. The line is somewhat stronger at positive velocities, suggesting a
self-absorption effect or some intrinsic asymmetry in the emitting region, and it
displays intensity bumps at 11 and 35 km s-1 in addition to the central
component at 22 km s-1and the HEVWs at − 4 and +48 km s-1. This
line is very similar to the JN =
76–65 of SO (see Fig. 3 in Tenenbaum et al. 2010b) and resembles those of 12CO
J = 2–1 and J = 3–2 (see Kemper et al. 2003; De Beck et al.
2010). Note that the excitation energy of the
JK =
level of
NH3, 27 K, is in between those of the J = 2 and
J = 3 levels of 12CO (17 and 33 K, respectively), but is
significantly lower than that of the upper level of the
JN = 76 of SO (47 K). The
total width5 of the line is also similar to those
of the CO lines, extending from about −30 km s-1 to +70 km s-1. In
spite of the relatively more complex profile of this line, we also characterized its
shape by fitting the three Gaussians; these results are shown in Fig. 8 and Table A.4.
) species.
These results are presented in Fig. 8. The results
of the JK =
– have
already been published by Menten et al. (2010).
The profile of this line is somehow unique in our survey because it is slightly
U-shaped. The line is somewhat stronger at positive velocities, suggesting a
self-absorption effect or some intrinsic asymmetry in the emitting region, and it
displays intensity bumps at 11 and 35 km s-1 in addition to the central
component at 22 km s-1and the HEVWs at − 4 and +48 km s-1. This
line is very similar to the JN =
76–65 of SO (see Fig. 3 in Tenenbaum et al. 2010b) and resembles those of 12CO
J = 2–1 and J = 3–2 (see Kemper et al. 2003; De Beck et al.
2010). Note that the excitation energy of the
JK =
level of
NH3, 27 K, is in between those of the J = 2 and
J = 3 levels of 12CO (17 and 33 K, respectively), but is
significantly lower than that of the upper level of the
JN = 76 of SO (47 K). The
total width5 of the line is also similar to those
of the CO lines, extending from about −30 km s-1 to +70 km s-1. In
spite of the relatively more complex profile of this line, we also characterized its
shape by fitting the three Gaussians; these results are shown in Fig. 8 and Table A.4.
Although the three observed J = 3–2 transitions appear to be blended,
it is clear that in these higher excitation lines only the central component is present.
We separated the contribution from the three lines by simultaneously fitting three
Gaussians (only the central component for each transition), assuming that the velocity
is the same (see Fig. 8). Our fitting shows that
both the JK =
– and
– lines are
well detected, showing FWHMs similar to that of the central component of the
JK =
– line (see
Table A.4). In contrast, the presence of
JK =
– emission
is not required by the fitting; this line should be at least four times weaker than the
– line.
Using the two lines detected for ortho-NH3, we derive a rotational
temperature of 55 K for the central component, lower than what we found for other
species. This excitation value also agrees with the detected intensity of the
–
transition if we adopt an ortho-to-para abundance ratio of 1:1, but is clearly in
conflict with the relative weakness of the – line,
whose upper level lies only 15 K above the ground state of para-NH3. However,
it must be noted that in VY CMa the
– line of
para-NH3 blends with the – one of
the ortho species. Since the multiplicity of the K = 0 levels is four
times that in the K = 1 ladder, the
JK =
– line
could be significantly more opaque than the – one, and
hence the intensity due to the para transition would be practically fully absorbed by
the ortho one if this latter is optically thick.
3.3.2. Hydroxyl radical and hydrogen sulphide (OH and H2S)
We detected the  J = 3/2–1/2
transition of OH at 1834.747 GHz (see Fig. 8). The
line is among the strongest in our survey, only surpassed by the strongest lines of
water. The profile6 is dominated by the central
component and displays a strong asymmetry between the two HEVWs; the intensity of the
red-shifted component is nearly six times that of the blue one. The profile is among the
widest we have observed in our HIFI survey, extending from −30 to +75 km s-1,
together with the low-level lines of water. This OH line, with
Eupp/k of 270 K, resembles the
v = 0 32,1–31,2 and
42,2–41,3 lines of H2O, with
Eupp/k of 271 and 454 K, respectively.
The similarity between the profiles of lines of similar excitation of these two
molecules suggests that these two species are also co-located, in agreement with the
hypothesis that the main source of OH formation is the photo-dissociation of
H2O.
J = 3/2–1/2
transition of OH at 1834.747 GHz (see Fig. 8). The
line is among the strongest in our survey, only surpassed by the strongest lines of
water. The profile6 is dominated by the central
component and displays a strong asymmetry between the two HEVWs; the intensity of the
red-shifted component is nearly six times that of the blue one. The profile is among the
widest we have observed in our HIFI survey, extending from −30 to +75 km s-1,
together with the low-level lines of water. This OH line, with
Eupp/k of 270 K, resembles the
v = 0 32,1–31,2 and
42,2–41,3 lines of H2O, with
Eupp/k of 271 and 454 K, respectively.
The similarity between the profiles of lines of similar excitation of these two
molecules suggests that these two species are also co-located, in agreement with the
hypothesis that the main source of OH formation is the photo-dissociation of
H2O.
The velocity range observed in the OH 1834.747 GHz line can be compared with those of
the OH masers at 18 cm, as the infrared pumping of these masers via the absorption of
stellar IR photons at 34.6 and 53.3 μm relates these Λ-doubling
transitions in the  J = 3/2
(ground) state with those connected by the rotational line observed with HIFI. The maser
emission at 1612 MHz (F = 1+–2−) spans the
velocity range between − 15 and +60 km s-1, and comes from a region about
18 in diameter
(see Benson & Mutel 1979, and references
therein), 3 × 1016 cm for a distance of 1.15 kpc. The velocity range of the
1612 MHz maser is only slightly smaller than the 1834.747 GHz thermal line. The extreme
velocities are only 10 km s-1 lower, but the two maxima of the U-shaped
1612 MHz line occur at ~− 8 and +50 km s-1, that is, very close to
the location of our HEVW components (−4.2 and 48.2 km s-1). These results
suggest that the 1612 MHz maser arises from the shells that give rise to our HEVW
components, and that these layers have a size of just a few arc-seconds. In addition,
the fact that the thermal line detected here is dominated by the central component
suggests that the photo-dissociation of water is taking place not only in the outermost
layers of the envelope where the OH masers are formed, but also in the accelerated inner
regions of the circumstellar shell.
J = 3/2
(ground) state with those connected by the rotational line observed with HIFI. The maser
emission at 1612 MHz (F = 1+–2−) spans the
velocity range between − 15 and +60 km s-1, and comes from a region about
18 in diameter
(see Benson & Mutel 1979, and references
therein), 3 × 1016 cm for a distance of 1.15 kpc. The velocity range of the
1612 MHz maser is only slightly smaller than the 1834.747 GHz thermal line. The extreme
velocities are only 10 km s-1 lower, but the two maxima of the U-shaped
1612 MHz line occur at ~− 8 and +50 km s-1, that is, very close to
the location of our HEVW components (−4.2 and 48.2 km s-1). These results
suggest that the 1612 MHz maser arises from the shells that give rise to our HEVW
components, and that these layers have a size of just a few arc-seconds. In addition,
the fact that the thermal line detected here is dominated by the central component
suggests that the photo-dissociation of water is taking place not only in the outermost
layers of the envelope where the OH masers are formed, but also in the accelerated inner
regions of the circumstellar shell.
We detected three lines of H2S: the JKa,Kc = 31,2–22,1 of ortho-H2S, and the 31,3–20,2 and 52,4–51,3 of para-H2S. A total of 20 lines of H2S lie within the HIFI observed bands, but we only detected intrinsically strong (ΔKa,ΔKc = ±1) transitions with Eupp/k ≲ 300 K. The spectra of the observed lines are shown in Fig. 8. All three lines appear to be blended with lines of SO and H2O, therefore we determined their intensities by means of multiple-Gaussian fittings. In this case, the fittings are particularly uncertain in view of the resulting line parameters (widths and centroids). Therefore, the results on H2S need be interpreted with caution. Assuming an ortho-to-para abundance ratio of 3:1, we derive a rotational temperature of 165 K, in agreement with the non-detection of lines with excitation energies ≳800 K.
3.4. Silicon monoxide (SiO)
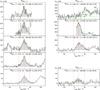 |
Fig. 10 Same as Fig. 3 for the detected lines of vibrationally excited 28SiO, and 29SiO (bottom-right panel). The 28SiO v = 2 J = 27–26 line possibly shows some maser amplification. |
We detected 15 lines of the three most abundant isotopic substitutions of silicon monoxide, 28SiO, 29SiO, and 30SiO, which have relative abundances of 30:1.5:1 in the solar system. These results are presented in Figs. 9 and 10 and in Table 3. For the main isotopic substitution, 28SiO, we detected the only two lines from the ground-vibrational state, v = 0, that we observed, the J = 14–13 and 16–15 transitions, with upper levels at excitation energies of 219 and 283 K, respectively. We also detected all the observed lines from the first and second vibrationally excited states, five v = 1 transitions between the J = 13–12 and the J = 40–39, with Eupp/k of 1957 and 3462 K, and the contiguous v = 2 transitions J = 26–25, 27–26, and 28–27, at about 4300 K above the ground level, the detection of the latter one is tentative. We also observed other lines of 28SiO between rotational levels in vibrational states with yet higher excitation, v ≥ 3, but this yielded no detections.
We detected all the observed rotational lines of 29SiO and 30SiO from the ground v = 0 vibrational state. These lines range from the J = 13–12 of 29SiO at 187 K excitation energy to the J = 42–41 of 30SiO with Eupp/k of 1832 K. We only detected one vibrationally excited line from these two rare isotopic substitutions: the v = 1 J = 16–15 of 29SiO. We also observed the v = 1 J = 18–17 line of 29SiO, but this transition overlaps the strong 21,1–20,2 line of para-H2O, therefore we cannot draw conclusions on its detection. We also observed, but failed to detect, the v = 1 J = 41–40 transition of 30SiO. No other v = 1 lines of 29SiO or 30SiO are covered by our observations. We also covered several v ≥ 2 transitions of the two rare isotopic substitutions of SiO, but these lines remain undetected.
From the comparison of the rotational diagrams for the different vibrational ladders of 28SiO, we can roughly derive the excitation conditions of these vibrationally excited states. This is a very relevant issue for the pumping of 28SiO masers from low-Jv = 1 and 2 states, which are widely observed in O-rich (and some S-type) long-period variables. From this comparison we infer vibrational excitation temperatures of 1500 K between the v = 0 and v = 1 rotational ladders of 28SiO and of 2500 K between the v = 1 and v = 2 states, which are similar to the excitation energy of these v > 0 states (the v = 1 and 2 states are about 1770 K and 3520 K above the ground, respectively). These temperatures are significantly higher than those derived just from the comparison of v = 1 rotational transitions of 28SiO, for which we obtain values between 300 and 550 K, much lower than the excitation energy of the levels, and similar to those derived for the v = 0 states of all SiO species. Radiation only connects levels with ΔJ = 1, and therefore the resulting excitation of the v > 0 levels can in principle mimic the much lower collisional excitation of the v = 0 states. In contrast, the collisional pumping of v > 0 states would yield similar (high) excitation temperatures (of the order of 1700 K and higher) for both pure rotational transitions in vibrationally excited states and ro-vibrational transitions. Our result supports the radiative-pumping model for the classical 28SiO masers (J = 1–0 and J = 2–1 in v = 1 and v = 2) against the collisional-pumping model (see Lockett & Elitzur 1992; Bujarrabal 1994, for more details).
The detected v = 2 transitions of 28SiO deserve some attention. The three lines connect the four contiguous levels J = 25 to 28. The strength of J = 27–26 line is between seven and ten times higher than the other two transitions, suggesting some over-excitation or maser effect in this line. Although the inversion of low-J masers of 28SiO can be explained with standard radiative models, the presence of masers in higher-J lines typically requires some additional effects, such as line overlapping with ro-vibrational lines of 28SiO or of some other abundant molecule (such as water). In our case, we identified a potential overlap between the ro-vibrational lines J = 27–28 v = 2–1 of 28SiO (λ = 8.519845 μm) and JKa,Kc = 103,8–114,7v2 = 1–0 of ortho-H2O (λ = 8.519933 μm), which are separated only by 3 km s-1.
The line profiles of the v = 0 lines (Fig. 9) display triangular or Gaussian-like shapes, which are characteristic of the envelope layers where the acceleration of the gas is still taking place and the final expansion velocity has not been attained yet. This is not surprising because the high dipole moment of SiO favours the selection of densest gas in the envelope, and SiO is expected to be severely depleted onto grains as the acceleration proceeds along with the dust formation. However, in spite of this, the two detected 28SiO transitions show a velocity range as wide as that covered by CO emission, from about − 30 to +70 km s-1(about ±50 km s-1 w.r.t. the systemic velocity of the source). Therefore, we can conclude that there are significant amounts of SiO in the gas phase even in the regions where the acceleration of the envelope and the grain growth have both ceased. A three-component Gaussian fit to the SiO lines (see Table A.4) gives FWHMs of 28–32 km s-1 for the central component, that is, about five to ten km s-1 narrower than those of the 12CO lines with similar excitation energy; only the J = 16–15 line of 12CO shows such a narrow central component, but at higher excitation. Considering their total velocity extent and the width for single-component Gaussian fits (Fig. 10), the profiles of the vibrationally excited SiO lines are certainly narrower than those of lines from v = 0 states. 28SiO v = 1 lines extend from −10 to 60 km s-1 at low-J and from 0 to 45 km s-1 at high-J. The Gaussian fits yield FWHMs of about 28 km s-1. This also applies to the the 28SiO v = 2 lines and the v = 1 J = 16–15 of 29SiO. These values are very similar to those obtained for the vibrationally excited lines of para-H2O, suggesting that in the inner regions of the envelope where these vibrationally excited lines arise, the turbulence and/or acceleration are relatively strong.
4. Conclusions
4.1. Sub-mm/FIR spectrum of VY CMa
From our observations we conclude that the sub-mm/FIR spectrum of VY CMa’s envelope is very rich in molecular spectral lines, in agreement with previous surveys (see Sect. 1). Considering this high density of lines and the broad intrinsic width of the spectral features in this source, between 50 and 100 km s-1 (100–600 MHz), we have almost reached the line confusion limit. About 48% of the observed bandwidth is occupied by molecular emission. In some cases, see the results from settings 14 and 08 in Fig. B.1, it has been very difficult to find emission-free areas to use for the residual baseline subtraction. In spite of the wide frequency range covered by our survey and the large number of detected molecular lines, we have not identified any new species.
We mostly detected diatomic oxides, CO, SiO, OH, SO, AlO, and PO. SiS and PN are the only diatomic species that do not contain oxygen. Most of the polyatomic species are hydrides, H2O, H2S, HCN, and the only species with four atoms, NH3. The only other polyatomic molecule is SO2, a dioxide. If we include the isotopic substitutions, the spectrum is dominated by lines of 28SiO (ten lines, plus five more from 29SiO and 30SiO), ortho-H2O (11+3) and para-H2O (10+3), SO (14), HCN (8+2), CO (3+4), and PO (7). SO2 is a special case. We may have detected up to 34 lines, but some of them are indistinguishable because they are severely blended. Of the 130 assigned lines, 24 (about 18%) are due to vibrationally excited states. This relatively high prevalence of highly excited lines is most likely due to the strong IR radiation field of the star and the dust envelope. This efficiently pumps molecules from the v = 0 states to vibrationally excited levels, greatly enhancing the emission of these transitions. We found that this effect is particularly strong for H2O, SiO, SO, and HCN. The measured high intensities of some lines also require the contribution of an additional source of excitation, such as the line overlap of IR lines.
The structure of the lines can be decomposed into several components. The lines are typically dominated by a central component of triangular or Gaussian shape that peaks at the systemic velocity of the source (22 km s-1 LRS) with FWHM values ~20–45 km s-1. This emission is sometimes accompanied by two HEVW components, centred at ~22 ± 26 km s-1. The width of the HEVWs is narrower, between 11–25 km s-1, but suggests a relatively strong (either micro- or most likely large-scale) turbulence in the gas. These two HEVW components are almost only present in lines with a relatively low excitation energy. Nevertheless, the extreme velocities displayed by both central and HEVW emission are very similar, reaching values of ±50 km s-1 w.r.t. the systemic velocity of the star. This high nebular expansion rate is similar to that of other super- and hyper-giants in the HIFISTARS sample, except for Betelgeuse, which has a significantly slower wind (see Teyssier et al. 2012).
 |
Fig. 11 Comparison of the integrated emission of different lines in HIFISTARS for VY CMa and the other four hyper- and super-giants in the project (see Teyssier et al. 2012). For each object, the integrated intensities of the different lines have been normalized to that of its J = 6–5 13CO transition. Horizontal bars and small squares show, respectively, values and upper limits for detected and undetected lines. See Sect. 4.2 for more details. |
HIFISTARS observations mostly probe the warm gas in the envelope: only H2O, NH3, and H2S have lines with upper levels at excitation energies below that of the J = 6 of 13CO and 12CO (Eupp/k of 111 and 116 K, respectively). In these cases we can see how the intensity of the HEVW components decreases with increasing excitation energy. In other species we mostly see the central component. Their triangular profiles suggest a strong acceleration in the velocity field of the gas: in some species we detected a trend of decreasing line-width with the excitation of the line (see Table A.4).
The clear separation between the HEVWs and the central component suggests that the
structures responsible for these two emissions are physically detached. The presence of
several mutually detached shells in the envelope around VY CMa agrees with the detailed images of this object (see Sect. 1). These nested structures have also been detected in
the envelopes of other massive stars (AFGL 2343
and IRC 10420, see Castro-Carrizo et al. 2007), and may be characteristic of this type of objects.
We note that in VY CMa the profiles of optically
thin lines, such as 13CO J = 6–5 and
NH3JK =
–, are very
similar to other massive sources in the HIFISTARS sample (Teyssier et al. 2012). All of these suggest discontinuous mass loss. Water is
detected in the HEVW and central components, and the same applies to OH, meaning that the
formation of OH from the dissociation of H2O does not only occur in the
outermost layers of the envelope. The lower excitation and high opacity of water in the
outer parts of the envelope results in strong self-absorbed profiles in its low-lying
lines, which in the case of HO
and HO
extend below the continuum level.
Typically, we measured rotational temperatures between 150 and 500 K for the central component, even among transitions originating from vibrationally excited levels. These values are usually lower for the HEVW components, between 75 and 200 K.
4.2. VY CMa and other massive stars in HIFISTARS
To compare our HIFISTARS results for VY CMa with
those obtained for other hyper- and super-giants in the project, which have been published
by Teyssier et al. (2012), we followed a procedure
similar to the one used in that paper. These authors compared the peak fluxes of the
different lines detected in NML Cyg, IRC +10420, Betelgeuse, and AFGL 2343,
correcting for the effects of the distance, size of the envelope, and amount of molecular
gas, by normalizing all values to the peak flux of the J = 6–5
12CO line. We included VY CMa in the
comparison and increased the number of studied transitions. Here we chose to represent the
integrated area values for the lines, because these figures are better correlated with the
total amount of molecular gas, and, for non-detections, the corresponding upper limits
provide better constraints. For these undetected lines, we took as upper limit the usual
value of 3 ,
where δv is the velocity resolution and n is the number
of channels typically covered by the lines in the source at zero power. This corresponds
to 60 km s-1 for NML Cyg, IRC +10420, and AFGL 2343, and 30 km s-1 for Betelgeuse. To avoid problems with the possible high opacity of the
12CO lines, we used the integrated intensity of the 13CO
J = 6–5 transition as the normalization factor. The results of this
comparison are presented in Fig. 11.
,
where δv is the velocity resolution and n is the number
of channels typically covered by the lines in the source at zero power. This corresponds
to 60 km s-1 for NML Cyg, IRC +10420, and AFGL 2343, and 30 km s-1 for Betelgeuse. To avoid problems with the possible high opacity of the
12CO lines, we used the integrated intensity of the 13CO
J = 6–5 transition as the normalization factor. The results of this
comparison are presented in Fig. 11.
As we can see in this figure, VY CMa is the
strongest emitter in lines of less abundant molecules (other than 12CO and
H2O). This result cannot be due to a relatively weak intensity of the
13CO J = 6–5 in VY CMa, which might be the case if 13C were less abundant than in
the other sources, since VY CMa is also the
strongest emitter in the 13CO J = 10–9 and H13CN
J = 8–7 lines. Therefore we must conclude that these rare molecular
species are more abundant in VY CMa than in the
other four sources. VY CMa is followed by
NML Cyg, and then by IRC +10420. Betelgeuse and AFGL 2343 are the
weakest of all. The contrast between VY CMa and
the other sources is stronger for lines with higher
Eupp/k, such as
v > 0 SiO lines and the ortho-H2O
v2 = 1 11,0–10,1 maser line, but also
for the relatively low excitation lines of SO included in the plot. Interestingly, the
only two lines in VY CMa that are surpassed by
NML Cyg are 13CO
J = 16–15 and para-HO
11,1–00,0. The relative weakness of the
para-HO
in VY CMa, w.r.t. NML Cyg, contrasts with the strength of all other H2O lines,
suggesting a lower abundance of this isotopic substitution in our target. We also note
that C18O remains undetected in our VY CMa spectra.
Online material
Appendix A: Detailed results for species not discussed in Sect. 3
Appendix A.1: Sulphur monoxide (SO)
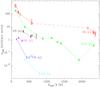 |
Fig. A.1 Rotational diagrams for some of the species discussed in this appendix: central component (c) only. Upper limits are marked with downward arrows. Solid lines join upper levels in the same vibrational state, while dashed lines join upper levels in different vibrational states. |
We detected three rotational JN– triplets (N = J, J–1 and J+1) of SO, the J = 13–12, 15–14 (only one component), and 23–22, with Eupp/k from about 190 to 580 K. We thus detected all the high line-strength SO transitions within the observed settings, except for one component of the J = 41–40, which lies at one of the edges of the setting 03 observation, and for which the upper limit obtained is not significant. Some other lines of SO of much lower line-strength, with JN– or with ΔJ > 1, also lie within the observed frequency ranges but yielded non-detections. In general, the upper limits of these lines are not significant either, except for those of the relatively low-lying lines JN = 99–89 and 1010–910, at 568.741 and 609.960 GHz respectively, and with upper-level energies of 106 and 127 K above the ground. Using the information from detections and the relevant upper limits, we built a rotation diagram for SO for the central component (see Tables A.1 and A.4 and Fig. A.1). We derive a rotation temperature of about 200–250 K, similar to that derived for other species from levels of similar excitation energies. The upper limits obtained for the lines at 106 and 127 K excitation energy indicate that the central component of SO cannot have a significant contribution from gas colder than about 60 K.
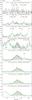 |
Fig. A.2 Same as Fig. 3 for the detected lines of SO. The v = 0 J = 23–22 and v = 1 J = 26–25 and 27–26 triplets are plotted in one panel each (fourth, second, and first from top). |
Spectral-line results for sulphur monoxide, phosphorous monoxide, aluminium monoxide, silicon sulphide, hydrogen cyanide, and phosphorous nitride.
In addition to these ground-vibrational lines, we detected some SO lines from the first vibrationally excited state v = 1, the JN– triplets J = 26–25 and J = 27–26 at 1108 and 1150 GHz, and one component (the other two are blended with a very strong water line) of the J = 23–22 triplet at 980.531 GHz. The upper levels of these lines lie between 2178 and 2386 K above the ground. As in the case of SiO, when comparing the rotational diagram of these v = 1 transitions with those from the v = 0, we see that the rotational temperature is very similar in spite of the much higher excitation energy of the v = 1 levels. In contrast, when we compare the intensity of similar rotational lines in the two vibrationally excited states, we derive vibrational excitation temperatures of about 2000 K. This result points out that the excitation of the vibrationally excited states is mostly due to radiative pumping for SO as well.
The profiles of the well-detected lines are triangular or Gaussian-like, see Fig. A.2. The FWHM values obtained for the central component show a clear decreasing trend with increasing excitation energy of the levels, ranging from 35 km s-1 for the v = 0 J = 13–12 lines to 20 km s-1 for the v = 0 J = 23–22 and all the v = 1 detected lines (though in these latter cases the S/N is poor and the results of the fittings are less accurate).
Appendix A.2: Sulphur dioxide (SO2)
Spectral-line results for sulphur dioxide.
Unassigned spectral features.
Triple-Gaussian fitting results for CO, H2O, NH3, SiO, SO, and SO2.
We tentatively detected 33 SO2 lines in our spectra, see Table A.2. Almost all these lines are only slightly stronger that the detection limit, therefore their parameters are rather uncertain. However, we verified that our identifications are compatible with an unresolved, optically thin emission with a rotational excitation of about 250–300 K. Under these assumptions we checked that only the lines listed in the table are visible in the spectra. Other lines may also be present, but they happen to overlap much stronger lines of other species and therefore cannot be analysed. The detected transitions have high line-strengths and Eupp/k ≲ 630 K.
In addition to these v = 0 lines, we identified another spectral feature that we tentatively assign to SO2. For a systemic velocity of 22 km s-1 and using a single-component Gaussian fitting, we derived rest frequencies of 1,096.860 GHz (if from the LSB) and 1,109.215 GHz (if from the USB) for the spectral feature that appears to the left of the v = 0 31,2–30,3 line of ortho-H2O in setting 08 (Fig. B.1). The spectral feature is clear (Fig. A.3), with a Tmb value of about 93 mK. This line is also tentatively detected in the spectra of other O-rich sources in HIFISTARS, such as o Cet, W Hya, and R Dor, and it is clearly absent from the C-rich envelope around IRC +10216, and in the O-rich envelopes around IK Tau, IRC +10011, and R Cas (HIFISTARS team, priv. comm.). These observations also suggest that the spectral feature arises from the LSB. We searched for lines in a 50 MHz (13.5 km s-1) interval around the two possible frequencies in the Splatalogue catalogue (http://www.splatalogue.net/) and in the private line catalogues of some of the members of the HIFISTARS team. According to this, the most likely candidate for our detection is the v2 = 1 JKa,Kc = 65,1–62,4 of SO2 at 1096.851 GHz. This line is only at 10 MHz (2.7 km s-1) from the LSB value derived from the fit. Indeed, this is the only catalogued line in these frequency ranges from a species previously detected in VY CMa. Nevertheless, the identification of the line is tentative because the 65,1–62,4 transition has a very low line-strength, it is a ΔK = 3 transition with log 10(Aul) = −6.85, but the detected spectral feature is relatively intense. In addition, it is a vibrationally excited line, its upper level being placed at more than 800 K above the ground. If plotted in a rotational diagram for SO2 lines, we observe that the detected intensity is five orders of magnitude higher than expected for LTE conditions. We can only explain this result if we assume that our line shows a strong maser effect. The FWHM of the line is 14 km s-1, a value similar to that of other lines arising from the inner envelope, such as those of NaCl and other vibrationally excited lines of SO2 (Ziurys et al. 2007; Tenenbaum & Ziurys 2010; Tenenbaum et al. 2010a). The line is slightly blue-shifted w.r.t. the systemic velocity (as is also the case for o Cet), which could be explained if the maser is due to an IR line overlap.
Appendix A.3: Other oxides: phosphorous monoxide and aluminium monoxide (PO and AlO)
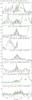 |
Fig. A.3 Same as Fig. 3 for the detected lines of AlO, and SiS, and some lines of SO2. The assignation of the v2 = 1 JKa,Kc = 65,1–62,4 line of SO2 is tentative. |
We detected several lines of PO, both from the
and
electronic states. The
transitions always come in paired features, corresponding to the
l = e and l = f
Λ-doubling components, while the always
show single features because we cannot separate the Λ-doubling
splitting in this case7. We clearly detected the
J
= 35/2–33/2, 45/2–43/2, and 51/2–49/2 pairs, with upper state energies at 338, 553,
and 707 K above the ground, respectively. Another two
transitions, the J = 79/2–77/2 and 83/2–81/2 with
Eupp/k of 1700 and 2100 K, were also
observed, but since they are blended with other stronger lines, we cannot conclusively
determine their presence. For the
transitions, we only detected the J = 31/2–29/2 at 589 K above the
ground. The J = 53/2–51/2 and 55/2–53/2 lines, at
Eupp/k ~ 1100 K, are also
within the band, but again they are blended with much stronger emission from other
species. In all cases the lines only show the central main component, see Fig. A.4. The rotational diagram suggests an excitation
temperature of 400 K (Fig. A.1).
We also detected two lines of AlO: the N = 20–19 and 29–28 transitions with Eupp/k of 386 and 798 K. The N = 45–44 and 49–48 transitions were also observed, but we did not detect them, the upper limits not being significant. The N = 29–28 line is detected at the edge of the band in the setting 08 observation, and should be considered as tentative (see Fig. A.3). Because of this, the estimate of the excitation temperature from the rotational diagram is very uncertain; we derive a value of 160 K, a rather low figure compared with the 230 K found by Tenenbaum & Ziurys (2009), but still compatible in view of the uncertainties. The N = 20–19 line is clearly detected, the profile just consisting in the central component.
Appendix A.4: Silicon sulphide (SiS)
We detected only one v = 0 rotational line of SiS, the J = 61–60 at 1102.029 GHz. The J = 104–103 at 1861.245 GHz is observed in setting 01, overlapping the vibrationally excited line of water at 1868.783 GHz, but it is very unlikely that we could have detected the SiS line since it has an upper state energy of 4723 K above the ground. No other v = 0 lines of SiS were observed, but several other rotational transitions of vibrationally excited states were covered by our survey. We did not detect any lines from states v = 2 and higher, but we tentatively detected two lines from the v = 1 levels: the J = 61–60 at 1096.635 GHz, and the J = 62–61 at 1114.431 GHz (this line has been also detected in OH 26.5+0.6, see Justtanont et al. 2012). In addition, we obtained significant upper limits for the v = 1 J = 55–54 and J = 64–63 transitions of SiS. The values obtained for the v = 1 J = 62–61 transition may be affected by the blending of this line with the v = 0 J = 26–25 line of 30SiO entering from the other side-band of the receiver, but they are very similar to the adjacent J = 61–60 line, which presents a clear detection. These two lines show just about half the strength of the v = 0 J = 61–60, even though they have an excitation energy of 2700 K, that is, 1600 K above the v = 0 line. This would suggest a relatively high excitation temperature between the v = 0 and v = 1 ladders due to the IR pumping of the v = 1 levels. However, the non-detection of the v = 1 J = 55–54 and J = 64–63 transitions suggests that the strength of the two detected v = 1 lines may also be enhanced by an IR line overlap.
Appendix A.5: Hydrogen cyanide (HCN)
We detected all the observed rotational transitions of HCN from the ground vibrational state: the J = 7–6, 13–12, and 20–19 lines, with Eupp/k of 119, 387, and 893 K. We also detected, although tentatively in some cases, all the HCN rotational lines within our bands from the vibrationally excited states v2 = 1 and v2 = 2: the J = 7–6, 13–12, and 20–19 l = 1e transitions of the v2 = 1 state, and the v2 = 1 J = 11–10 l = 1f and v2 = 2 J = 11–10 l = 2e lines. Two other lines from the v1 = 1 and v3 = 1 states were also observed, but were not detected.
The profiles of all these lines show only the central component. Including the data for vibrationally excited transitions, we found a noisy trend when plotting the FWHMs of the lines against the excitation energy of the upper levels. Lines with relatively low excitation energy, for instance, the v = 0 J = 7–6, show FWHM values higher than 40 km s-1, while values lower than 20 km s-1 are found for transitions with ≥Eupp/k of 1500 K. This result suggests that the vibrationally excited lines of HCN arise from the inner regions of the envelope where the final expansion velocity has not been attained yet.
The rotational diagram for HCN shows excitation temperatures between 90 and 250 K for the v = 0 lines, and of about 200 K for the v2 = 1 lines (Fig. A.1). If we compare similar rotational transitions in different vibrational states, we obtain excitation temperatures of 210–350 K between the v = 0 and v2 = 1 ladders (and of 1500 K between the v2 = 1 and v2 = 2 ladders, but this a very tentative result). This would suggest, although less clearly than in the cases of H2O, SiO, and SO, that the excitation of the v2 = 1 and 2 levels in HCN is also dominated by the IR radiation pumping.
We also systematically searched for lines of H13CN in our spectra, both from the ground and the v2 = 1 states. We detected the v = 0 J = 8–7 and (tentatively) the J = 14–13 lines, with Eupp/k of 145 and 435, respectively. No vibrationally excited lines were detected in our data, which include the frequencies of the v2 = 1 J = 7–6 and J = 8–7 transitions. Because of the severe blending of the v = 0 J = 14–13 line (it is at the edge of the strong 42,2–41,3 line of para-H2O), the results from the rotational diagram of H13CN can only be considered as tentative. We derive
an excitation temperature of about 90 K, very similar to the value for HCN between similar transitions, suggesting that the lines from both species are optically thin.
Appendix A.6: Phosphorous nitride (PN)
In addition to NH3 and HCN, the other N-bearing molecule identified in VY CMa in our HIFI spectra is PN. We detected the only two (ground-vibrational state) rotational lines covered by our observations, the N = 13–12 and 16–15 multiplets (six unresolved components within 4 MHz), with upper level energies of 205 and 307 K above the ground. The lines are relatively narrow, with FWHPs of less than 20 km s-1, suggesting that the emission originates in the inner shells of the envelope. The excitation temperature derived from the rotational diagram is about 220 K. Two v = 1 multiplets, the N = 12–11 and 25–24 at 559.7 and 1164.4 GHz, were also observed but were not detected, the limits are irrelevant.
Appendix A.7: Unassigned spectral features
There are three spectral features in our spectra that we were unable to unambiguously assign to any molecular line. They are listed in Table A.3 and are marked “U” in green in Fig. B.1. For the two in settings 13 and 14, 29SiS is a good candidate. For the other U-line in setting 11, the most likely candidate is 33SO (JN = 1818–1717 at 766.263 GHz). In other HIFISTARS observations, the U-features in settings 13 and 14 are also detected in C-rich envelopes, whereas that in setting 11 seems to be present in other O-rich sources, which would support our conjectures.
Appendix B: Full Herschel/HIFI WBS spectra
Here we present the full-bandwidth results of our Herschel/HIFI WBS observations of VY CMa. In Fig. B.1 we show the results for LO frequencies of 1102.9 GHz and lower: these are, from bottom to top, settings 14, 13, 12, 17, 11, 10, 09, and 08. In Fig. B.2 we show the results for LO frequencies of 1106.9 GHz and higher: these are, from bottom to top, settings 07, 06, 05, 04, 03, 19, 16, and 01. The Tmb observed with HIFI/WBS is plotted vs. both LSB (lower x-axis) and USB (upper x-axis) rest-frequency scales (in GHz), assuming an LSR systemic velocity of 22 km s-1 for the source. The location of the detected lines from the LSB/USB is indicated by the red and blue arrows and labels. The point of the arrow marks the appropriate axis in each case. Unassigned features are labelled “U” in green, and arrows point to the two possible rest frequencies. We note that setting 16 was observed twice using a slightly different LSR velocity for the source; since we cannot average these two spectra simultaneously aligning the two (side-band) frequency scales, in Fig. B.2 we only show the result for OBSID 1342196570.
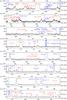 |
Fig. B.1 Full WBS bandwidth HIFI results for VY CMa for LO frequencies of 1102.9 GHz and lower. Quantum numbers for SO2 transitions are not given for clarity. |
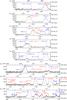 |
Fig. B.2 Full WBS bandwidth HIFI results for VY CMa for LO frequencies of 1106.9 GHz and higher. Quantum numbers for SO2 transitions are not given for clarity. |
Formerly known as the Heinrich Hertz telescope.
HIPE is a joint development by the Herschel Science Ground Segment Consortium, consisting of ESA, the NASA Herschel Science Center, and the HIFI, PACS, and SPIRE consortia. Visit http://herschel.esac.esa.int/HIPE_download.shtml for additional information.
The standard HIPE pipeline does perform this time average, but does not perform sub-band stitching by default, providing just a single spectrum per receiver and WBS unit.
CLASS is part of the GILDAS software package, developed and maintained by IRAM, LAOG/Univ. de Grenoble, LAB/Obs. de Bordeaux, and LERMA/Obs. de Paris. For more details, see http://www.iram.fr/IRAMFR/GILDAS
The splitting of the hyperfine structure of these rotational lines of ammonia is very small, just 1.6 km s-1 in the J = 1–0 line and less than 0.5 km s-1 in the J = 3–2 lines.
We note that this transition has three hyperfine components, at −0.6, 0.0, +1.9 km s-1 w.r.t. the quoted frequency, but this small total separation of 2.5 km s-1 has little influence on the discussion that follows.
We only consider the strongest hyperfine components, for
J = j–(j–1) the F =
(j+1/2)–(j–1/2) and F =
(j–1/2)–(j–3/2) components, which are not resolved in
VY CMa for both
and
electronic
states.
Acknowledgments
HIFI has been designed and built by a consortium of institutes and university departments from across Europe, Canada, and the United States under the leadership of SRON (Netherlands Institute for Space Research), Groningen, The Netherlands, and with major contributions from Germany, France, and the US. Consortium members are: Canada: CSA, U. Waterloo; France: CESR, LAB, LERMA, IRAM; Germany: KOSMA, MPIfR, MPS; Ireland: NUI Maynooth; Italy: ASI, IFSI-INAF, Osservatorio Astrofisico di Arcetri-INAF; The Netherlands: SRON, TUD; Poland: CAMK, CBK; Spain: Observatorio Astronmico Nacional (IGN), Centro de Astrobiologa (CSIC-INTA); Sweden: Chalmers University of Technology MC2, RSS & GARD, Onsala Space Observatory, Swedish National Space Board, Stockholm University-Stockholm Observatory; Switzerland: ETH Zurich, FHNW; USA: Caltech, J.P.L., NHSC. HIFISTARS: The physical and chemical properties of circumstellar environments around evolved stars, P.I. V. Bujarrabal, is a Herschel/HIFI guaranteed time key program (KPGT_vbujarra_1) devoted to the study of the warm gas and water vapour contents of the molecular envelopes around evolved stars: AGB stars, red super- and hyper-giants; and their descendants: pre-planetary nebulae, planetary nebulae, and yellow hyper-giants. HIFISTARS comprises 366 observations, totalling 11 186 min of Herschel/HIFI telescope time. See http://hifistars.oan.es; and Key_Programmes.shtml and UserProvidedDataProducts.shtml in the Herschel web portal (http://herschel.esac.esa.int/) for additional details. This work has been partially supported by the Spanish MICINN, program CONSOLIDER INGENIO 2010, grant “ASTROMOL” (CSD2009-00038); and by the German Deutsche Forschungsgemeinschaft, DFG project number Os 177/1–1. A portion of this research was performed at the Jet Propulsion Laboratory, California Institute of Technology, under contract with the National Aeronautics and Space Administration. R.S.z. and M.S.ch. acknowledge support from grant N203 581040 of National Science Center. K.J., F.S., and H.O. acknowledge funding from the Swedish National Space Board. J.C. thanks for funding from the Spanish MICINN, grant AYA2009-07304.
References
- Benson, J. M., & Mutel, R. L. 1979, ApJ, 233, 119 [NASA ADS] [CrossRef] [Google Scholar]
- Bujarrabal, V. 1994, A&A, 285, 953 [NASA ADS] [Google Scholar]
- Bujarrabal, V., Alcolea, J., Soria-Ruiz, R., et al. 2012, A&A, 537, A8 [NASA ADS] [CrossRef] [EDP Sciences] [Google Scholar]
- Castro-Carrizo, A., Quintana-Lacaci, G., Bujarrabal, V., Neri, R., & Alcolea, J. 2007, A&A, 465, 457 [NASA ADS] [CrossRef] [EDP Sciences] [Google Scholar]
- Cernicharo, J., Bujarrabal, V., & Santaren, J. L. 1993, ApJ, 407, L33 [NASA ADS] [CrossRef] [Google Scholar]
- Choi, Y. K., Hirota, T., Honma, M., et al. 2008, PASJ, 60, 1007 [NASA ADS] [Google Scholar]
- De Beck, E., Decin, L., de Koter, A., et al. 2010, A&A, 523, A18 [NASA ADS] [CrossRef] [EDP Sciences] [Google Scholar]
- de Graauw, T., Helmich, F. P., Phillips, T. G., et al. 2010, A&A, 518, L6 [NASA ADS] [CrossRef] [EDP Sciences] [Google Scholar]
- de Jager, C. 1998, A&ARv., 8, 145 [NASA ADS] [CrossRef] [Google Scholar]
- Decin, L., Hony, S., de Koter, A., et al. 2006, A&A, 456, 549 [NASA ADS] [CrossRef] [EDP Sciences] [Google Scholar]
- Fu, R. R., Moullet, A., Patel, N. A., et al. 2012, ApJ, 746, 42 [NASA ADS] [CrossRef] [Google Scholar]
- Goldsmith, P. F., & Langer, W. D. 1999, ApJ, 517, 209 [NASA ADS] [CrossRef] [Google Scholar]
- Harwit, M., Houde, M., Sonnentrucker, P., et al. 2010, A&A, 521, L51 [NASA ADS] [CrossRef] [EDP Sciences] [Google Scholar]
- Herbig, G. H. 1970, ApJ, 162, 557 [NASA ADS] [CrossRef] [Google Scholar]
- Humphreys, R. M. 1974, ApJ, 188, 75 [Google Scholar]
- Humphreys, R. M., & Davidson, K. 1994, PASP, 106, 1025 [NASA ADS] [CrossRef] [Google Scholar]
- Humphreys, R. M., Helton, L. A., & Jones, T. J. 2007, AJ, 133, 2716 [NASA ADS] [CrossRef] [Google Scholar]
- Justtanont, K., Khouri, T., Maercker, M., et al. 2012, A&A, 537, A144 [NASA ADS] [CrossRef] [EDP Sciences] [Google Scholar]
- Kamiński, T., Gottlieb, C. A., Menten, K. M., et al. 2013, A&A, 551, A113 [NASA ADS] [CrossRef] [EDP Sciences] [Google Scholar]
- Kemper, F., Stark, R., Justtanont, K., et al. 2003, A&A, 407, 609 [NASA ADS] [CrossRef] [EDP Sciences] [Google Scholar]
- Knapp, G. R., Sandell, G., & Robson, E. I. 1993, ApJS, 88, 173 [NASA ADS] [CrossRef] [Google Scholar]
- Lockett, P., & Elitzur, M. 1992, ApJ, 399, 704 [NASA ADS] [CrossRef] [Google Scholar]
- Menten, K. M., & Young, K. 1995, ApJ, 450, L67 [NASA ADS] [CrossRef] [Google Scholar]
- Menten, K. M., Philipp, S. D., Güsten, R., et al. 2006, A&A, 454, L107 [NASA ADS] [CrossRef] [EDP Sciences] [Google Scholar]
- Menten, K. M., Wyrowski, F., Alcolea, J., et al. 2010, A&A, 521, L7 [NASA ADS] [CrossRef] [EDP Sciences] [Google Scholar]
- Muller, S., Dinh-V-Trung, Lim, J., et al. 2007, ApJ, 656, 1109 [NASA ADS] [CrossRef] [Google Scholar]
- Neufeld, D. A., Feuchtgruber, H., Harwit, M., & Melnick, G. J. 1999, ApJ, 517, L147 [Google Scholar]
- Perrine, C. D. 1923, PASP, 35, 229 [NASA ADS] [CrossRef] [Google Scholar]
- Pilbratt, G. L., Riedinger, J. R., Passvogel, T., et al. 2010, A&A, 518, L1 [CrossRef] [EDP Sciences] [Google Scholar]
- Polehampton, E. T., Menten, K. M., van der Tak, F. F. S., & White, G. J. 2010, A&A, 510, A80 [NASA ADS] [CrossRef] [EDP Sciences] [Google Scholar]
- Roelfsema, P. R., Helmich, F. P., Teyssier, D., et al. 2012, A&A, 537, A17 [NASA ADS] [CrossRef] [EDP Sciences] [Google Scholar]
- Royer, P., Decin, L., Wesson, R., et al. 2010, A&A, 518, L145 [NASA ADS] [CrossRef] [EDP Sciences] [Google Scholar]
- Smith, N., Humphreys, R. M., Davidson, K., et al. 2001, AJ, 121, 1111 [NASA ADS] [CrossRef] [Google Scholar]
- Smith, N., Hinkle, K. H., & Ryde, N. 2009, AJ, 137, 3558 [NASA ADS] [CrossRef] [Google Scholar]
- Tenenbaum, E. D., & Ziurys, L. M. 2009, ApJ, 694, L59 [NASA ADS] [CrossRef] [Google Scholar]
- Tenenbaum, E. D., & Ziurys, L. M. 2010, ApJ, 712, L93 [NASA ADS] [CrossRef] [Google Scholar]
- Tenenbaum, E. D., Dodd, J. L., Milam, S. N., Woolf, N. J., & Ziurys, L. M. 2010a, ApJ, 720, L102 [NASA ADS] [CrossRef] [Google Scholar]
- Tenenbaum, E. D., Dodd, J. L., Milam, S. N., Woolf, N. J., & Ziurys, L. M. 2010b, ApJS, 190, 348 [NASA ADS] [CrossRef] [MathSciNet] [Google Scholar]
- Teyssier, D., Quintana-Lacaci, G., Marston, A. P., et al. 2012, A&A, 545, A99 [NASA ADS] [CrossRef] [EDP Sciences] [Google Scholar]
- Verheyen, L. 2011, Ph.D. Thesis, Univ. of Bonn [Google Scholar]
- Wallerstein, G. 1958, PASP, 70, 479 [NASA ADS] [CrossRef] [Google Scholar]
- Wittkowski, M., Langer, N., & Weigelt, G. 1998, A&A, 340, L39 [NASA ADS] [Google Scholar]
- Wittkowski, M., Hauschildt, P. H., Arroyo-Torres, B., & Marcaide, J. M. 2012, A&A, 540, L12 [NASA ADS] [CrossRef] [EDP Sciences] [Google Scholar]
- Zhang, B., Reid, M. J., Menten, K. M., & Zheng, X. W. 2012, ApJ, 744, 23 [NASA ADS] [CrossRef] [Google Scholar]
- Ziurys, L. M., Milam, S. N., Apponi, A. J., & Woolf, N. J. 2007, Nature, 447, 1094 [Google Scholar]
- Ziurys, L. M., Tenenbaum, E. D., Pulliam, R. L., Woolf, N. J., & Milam, S. N. 2009, ApJ, 695, 1604 [NASA ADS] [CrossRef] [Google Scholar]
All Tables
Spectral-line results for ammonia, hydrogen sulphide, hydroxyl, and silicon monoxide.
Spectral-line results for sulphur monoxide, phosphorous monoxide, aluminium monoxide, silicon sulphide, hydrogen cyanide, and phosphorous nitride.
All Figures
|
Fig. 1 Rotational diagrams for species discussed in Sect. 3 with emission from vibrationally excited levels: for H2O and 28SiO, central (c) and red-HEVW (r) components; for 29SiO and 30SiO, central component (c) only. Solid lines join upper levels in the same vibrational state, while dashed lines join upper levels in different vibrational states. 28SiO and H2O maser lines, indicated with an asterisk (*), are connected to their respective diagrams by vertical dotted lines. |
| In the text | |
|
Fig. 2 Rotational diagrams for species discussed in Sect. 3 with no emission from vibrationally excited levels: for 12CO, central (c) and red-HEVW (r) components; for 13CO, NH3, and H2S, central component (c) only. Upper limits are marked with downward arrows. |
| In the text | |
|
Fig. 3 Results for 12CO and 13CO from HIFISTARS observations. Line name, rest frequency (GHz), setting and side-band in which the line has been observed, and HPBW of the telescope at the frequency are also given. The grey area below the intensity histogram indicates the integrated line intensity quoted in Table 2. The horizontal axis gives the Doppler velocity for the adopted rest frequency. The intensities are given in Tmb scale. The vertical dashed lines mark the velocities adopted for the central and HEVW components. The green lines show Gaussian fits either for the HEVW and main components or for blended lines, and their composite profile. See Sects. 3 and 3.1 for more details. Labels for other lines in the spectra are also given in the cases of blended lines. |
| In the text | |
|
Fig. 4 Same as Fig. 3 for the detected v = 0 lines of ortho-H2O. Note the distinctive profile of the JKa,Kc = 53,2–44,1 maser line. The location of the undetected JKa,Kc = 53,3–60,6 line of para-H2O is also indicated. |
| In the text | |
|
Fig. 5 Same as Fig. 3 for the detected v = 0 lines of para-H2O. Note the distinctive profile of the JKa,Kc = 52,4–43,1 maser line. |
| In the text | |
|
Fig. 6 Same as Fig. 3 for the detected lines of vibrationally excited water. Note the narrow profile of the v2 = 1 JKa,Kc = 11,0–10,1 line in the bottom-left panel, indicating its maser origin. This may also be the case of the v1,2 = 1,1 JKa,Kc = 31,2–30,3 line in the top-left panel. |
| In the text | |
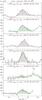 |
Fig. 7 Same as Fig. 3 for the detected lines of isotopomers of water. |
| In the text | |
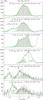 |
Fig. 8 Same as Fig. 3 for the detected lines of other hydrides: H2S. NH3, and the OH radical. |
| In the text | |
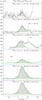 |
Fig. 9 Same as Fig. 3 for the detected v = 0 lines of 28SiO, 29SiO, and 30SiO. |
| In the text | |
|
Fig. 10 Same as Fig. 3 for the detected lines of vibrationally excited 28SiO, and 29SiO (bottom-right panel). The 28SiO v = 2 J = 27–26 line possibly shows some maser amplification. |
| In the text | |
|
Fig. 11 Comparison of the integrated emission of different lines in HIFISTARS for VY CMa and the other four hyper- and super-giants in the project (see Teyssier et al. 2012). For each object, the integrated intensities of the different lines have been normalized to that of its J = 6–5 13CO transition. Horizontal bars and small squares show, respectively, values and upper limits for detected and undetected lines. See Sect. 4.2 for more details. |
| In the text | |
|
Fig. A.1 Rotational diagrams for some of the species discussed in this appendix: central component (c) only. Upper limits are marked with downward arrows. Solid lines join upper levels in the same vibrational state, while dashed lines join upper levels in different vibrational states. |
| In the text | |
|
Fig. A.2 Same as Fig. 3 for the detected lines of SO. The v = 0 J = 23–22 and v = 1 J = 26–25 and 27–26 triplets are plotted in one panel each (fourth, second, and first from top). |
| In the text | |
|
Fig. A.3 Same as Fig. 3 for the detected lines of AlO, and SiS, and some lines of SO2. The assignation of the v2 = 1 JKa,Kc = 65,1–62,4 line of SO2 is tentative. |
| In the text | |
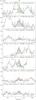 |
Fig. A.4 Same as Fig. 3 for the detected lines of PO. |
| In the text | |
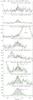 |
Fig. A.5 Same as Fig. 3 for the detected lines of HCN, H13CN, and PN. |
| In the text | |
|
Fig. B.1 Full WBS bandwidth HIFI results for VY CMa for LO frequencies of 1102.9 GHz and lower. Quantum numbers for SO2 transitions are not given for clarity. |
| In the text | |
|
Fig. B.2 Full WBS bandwidth HIFI results for VY CMa for LO frequencies of 1106.9 GHz and higher. Quantum numbers for SO2 transitions are not given for clarity. |
| In the text | |
Current usage metrics show cumulative count of Article Views (full-text article views including HTML views, PDF and ePub downloads, according to the available data) and Abstracts Views on Vision4Press platform.
Data correspond to usage on the plateform after 2015. The current usage metrics is available 48-96 hours after online publication and is updated daily on week days.
Initial download of the metrics may take a while.