Fig. 3
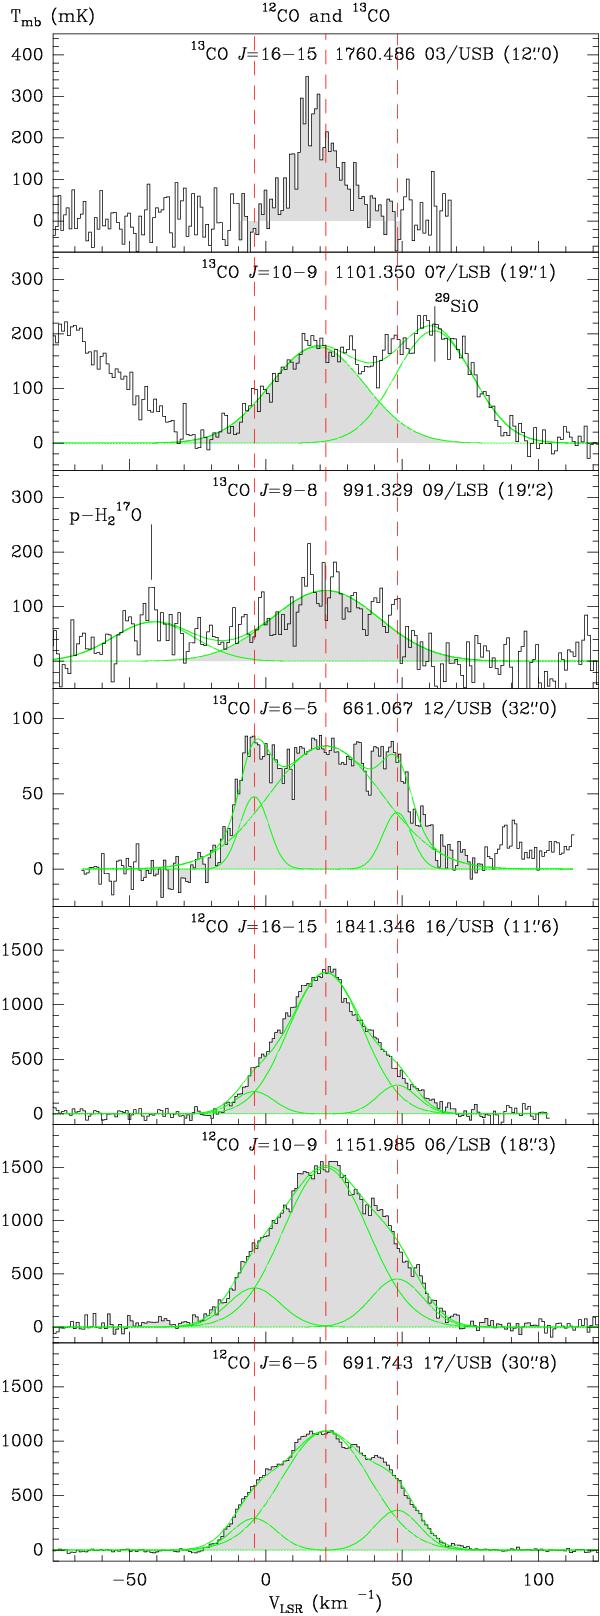
Results for 12CO and 13CO from HIFISTARS observations. Line name, rest frequency (GHz), setting and side-band in which the line has been observed, and HPBW of the telescope at the frequency are also given. The grey area below the intensity histogram indicates the integrated line intensity quoted in Table 2. The horizontal axis gives the Doppler velocity for the adopted rest frequency. The intensities are given in Tmb scale. The vertical dashed lines mark the velocities adopted for the central and HEVW components. The green lines show Gaussian fits either for the HEVW and main components or for blended lines, and their composite profile. See Sects. 3 and 3.1 for more details. Labels for other lines in the spectra are also given in the cases of blended lines.
Current usage metrics show cumulative count of Article Views (full-text article views including HTML views, PDF and ePub downloads, according to the available data) and Abstracts Views on Vision4Press platform.
Data correspond to usage on the plateform after 2015. The current usage metrics is available 48-96 hours after online publication and is updated daily on week days.
Initial download of the metrics may take a while.