| Issue |
A&A
Volume 559, November 2013
|
|
|---|---|---|
| Article Number | A93 | |
| Number of page(s) | 25 | |
| Section | Interstellar and circumstellar matter | |
| DOI | https://doi.org/10.1051/0004-6361/201321683 | |
| Published online | 21 November 2013 | |
Online material
Appendix A: Detailed results for species not discussed in Sect. 3
Appendix A.1: Sulphur monoxide (SO)
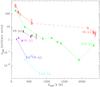 |
Fig. A.1
Rotational diagrams for some of the species discussed in this appendix: central component (c) only. Upper limits are marked with downward arrows. Solid lines join upper levels in the same vibrational state, while dashed lines join upper levels in different vibrational states. |
| Open with DEXTER | |
We detected three rotational JN– triplets (N = J, J–1 and J+1) of SO, the J = 13–12, 15–14 (only one component), and 23–22, with Eupp/k from about 190 to 580 K. We thus detected all the high line-strength SO transitions within the observed settings, except for one component of the J = 41–40, which lies at one of the edges of the setting 03 observation, and for which the upper limit obtained is not significant. Some other lines of SO of much lower line-strength, with JN– or with ΔJ > 1, also lie within the observed frequency ranges but yielded non-detections. In general, the upper limits of these lines are not significant either, except for those of the relatively low-lying lines JN = 99–89 and 1010–910, at 568.741 and 609.960 GHz respectively, and with upper-level energies of 106 and 127 K above the ground. Using the information from detections and the relevant upper limits, we built a rotation diagram for SO for the central component (see Tables A.1 and A.4 and Fig. A.1). We derive a rotation temperature of about 200–250 K, similar to that derived for other species from levels of similar excitation energies. The upper limits obtained for the lines at 106 and 127 K excitation energy indicate that the central component of SO cannot have a significant contribution from gas colder than about 60 K.
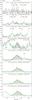 |
Fig. A.2
Same as Fig. 3 for the detected lines of SO. The v = 0 J = 23–22 and v = 1 J = 26–25 and 27–26 triplets are plotted in one panel each (fourth, second, and first from top). |
| Open with DEXTER | |
Spectral-line results for sulphur monoxide, phosphorous monoxide, aluminium monoxide, silicon sulphide, hydrogen cyanide, and phosphorous nitride.
In addition to these ground-vibrational lines, we detected some SO lines from the first vibrationally excited state v = 1, the JN– triplets J = 26–25 and J = 27–26 at 1108 and 1150 GHz, and one component (the other two are blended with a very strong water line) of the J = 23–22 triplet at 980.531 GHz. The upper levels of these lines lie between 2178 and 2386 K above the ground. As in the case of SiO, when comparing the rotational diagram of these v = 1 transitions with those from the v = 0, we see that the rotational temperature is very similar in spite of the much higher excitation energy of the v = 1 levels. In contrast, when we compare the intensity of similar rotational lines in the two vibrationally excited states, we derive vibrational excitation temperatures of about 2000 K. This result points out that the excitation of the vibrationally excited states is mostly due to radiative pumping for SO as well.
The profiles of the well-detected lines are triangular or Gaussian-like, see Fig. A.2. The FWHM values obtained for the central component show a clear decreasing trend with increasing excitation energy of the levels, ranging from 35 km s-1 for the v = 0 J = 13–12 lines to 20 km s-1 for the v = 0 J = 23–22 and all the v = 1 detected lines (though in these latter cases the S/N is poor and the results of the fittings are less accurate).
Appendix A.2: Sulphur dioxide (SO2)
Spectral-line results for sulphur dioxide.
Unassigned spectral features.
Triple-Gaussian fitting results for CO, H2O, NH3, SiO, SO, and SO2.
We tentatively detected 33 SO2 lines in our spectra, see Table A.2. Almost all these lines are only slightly stronger that the detection limit, therefore their parameters are rather uncertain. However, we verified that our identifications are compatible with an unresolved, optically thin emission with a rotational excitation of about 250–300 K. Under these assumptions we checked that only the lines listed in the table are visible in the spectra. Other lines may also be present, but they happen to overlap much stronger lines of other species and therefore cannot be analysed. The detected transitions have high line-strengths and Eupp/k ≲ 630 K.
In addition to these v = 0 lines, we identified another spectral feature that we tentatively assign to SO2. For a systemic velocity of 22 km s-1 and using a single-component Gaussian fitting, we derived rest frequencies of 1,096.860 GHz (if from the LSB) and 1,109.215 GHz (if from the USB) for the spectral feature that appears to the left of the v = 0 31,2–30,3 line of ortho-H2O in setting 08 (Fig. B.1). The spectral feature is clear (Fig. A.3), with a Tmb value of about 93 mK. This line is also tentatively detected in the spectra of other O-rich sources in HIFISTARS, such as o Cet, W Hya, and R Dor, and it is clearly absent from the C-rich envelope around IRC +10216, and in the O-rich envelopes around IK Tau, IRC +10011, and R Cas (HIFISTARS team, priv. comm.). These observations also suggest that the spectral feature arises from the LSB. We searched for lines in a 50 MHz (13.5 km s-1) interval around the two possible frequencies in the Splatalogue catalogue (http://www.splatalogue.net/) and in the private line catalogues of some of the members of the HIFISTARS team. According to this, the most likely candidate for our detection is the v2 = 1 JKa,Kc = 65,1–62,4 of SO2 at 1096.851 GHz. This line is only at 10 MHz (2.7 km s-1) from the LSB value derived from the fit. Indeed, this is the only catalogued line in these frequency ranges from a species previously detected in VY CMa. Nevertheless, the identification of the line is tentative because the 65,1–62,4 transition has a very low line-strength, it is a ΔK = 3 transition with log 10(Aul) = −6.85, but the detected spectral feature is relatively intense. In addition, it is a vibrationally excited line, its upper level being placed at more than 800 K above the ground. If plotted in a rotational diagram for SO2 lines, we observe that the detected intensity is five orders of magnitude higher than expected for LTE conditions. We can only explain this result if we assume that our line shows a strong maser effect. The FWHM of the line is 14 km s-1, a value similar to that of other lines arising from the inner envelope, such as those of NaCl and other vibrationally excited lines of SO2 (Ziurys et al. 2007; Tenenbaum & Ziurys 2010; Tenenbaum et al. 2010a). The line is slightly blue-shifted w.r.t. the systemic velocity (as is also the case for o Cet), which could be explained if the maser is due to an IR line overlap.
Appendix A.3: Other oxides: phosphorous monoxide and aluminium monoxide (PO and AlO)
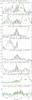 |
Fig. A.3
Same as Fig. 3 for the detected lines of AlO, and SiS, and some lines of SO2. The assignation of the v2 = 1 JKa,Kc = 65,1–62,4 line of SO2 is tentative. |
| Open with DEXTER | |
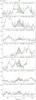 |
Fig. A.4
Same as Fig. 3 for the detected lines of PO. |
| Open with DEXTER | |
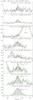 |
Fig. A.5
Same as Fig. 3 for the detected lines of HCN, H13CN, and PN. |
| Open with DEXTER | |
We detected several lines of PO, both from the
 and
and
 electronic states. The
transitions always come in paired features, corresponding to the
l = e and l = f
Λ-doubling components, while the always
show single features because we cannot separate the Λ-doubling
splitting in this case7. We clearly detected the
J
= 35/2–33/2, 45/2–43/2, and 51/2–49/2 pairs, with upper state energies at 338, 553,
and 707 K above the ground, respectively. Another two
transitions, the J = 79/2–77/2 and 83/2–81/2 with
Eupp/k of 1700 and 2100 K, were also
observed, but since they are blended with other stronger lines, we cannot conclusively
determine their presence. For the
transitions, we only detected the J = 31/2–29/2 at 589 K above the
ground. The J = 53/2–51/2 and 55/2–53/2 lines, at
Eupp/k ~ 1100 K, are also
within the band, but again they are blended with much stronger emission from other
species. In all cases the lines only show the central main component, see Fig. A.4. The rotational diagram suggests an excitation
temperature of 400 K (Fig. A.1).
electronic states. The
transitions always come in paired features, corresponding to the
l = e and l = f
Λ-doubling components, while the always
show single features because we cannot separate the Λ-doubling
splitting in this case7. We clearly detected the
J
= 35/2–33/2, 45/2–43/2, and 51/2–49/2 pairs, with upper state energies at 338, 553,
and 707 K above the ground, respectively. Another two
transitions, the J = 79/2–77/2 and 83/2–81/2 with
Eupp/k of 1700 and 2100 K, were also
observed, but since they are blended with other stronger lines, we cannot conclusively
determine their presence. For the
transitions, we only detected the J = 31/2–29/2 at 589 K above the
ground. The J = 53/2–51/2 and 55/2–53/2 lines, at
Eupp/k ~ 1100 K, are also
within the band, but again they are blended with much stronger emission from other
species. In all cases the lines only show the central main component, see Fig. A.4. The rotational diagram suggests an excitation
temperature of 400 K (Fig. A.1).
We also detected two lines of AlO: the N = 20–19 and 29–28 transitions with Eupp/k of 386 and 798 K. The N = 45–44 and 49–48 transitions were also observed, but we did not detect them, the upper limits not being significant. The N = 29–28 line is detected at the edge of the band in the setting 08 observation, and should be considered as tentative (see Fig. A.3). Because of this, the estimate of the excitation temperature from the rotational diagram is very uncertain; we derive a value of 160 K, a rather low figure compared with the 230 K found by Tenenbaum & Ziurys (2009), but still compatible in view of the uncertainties. The N = 20–19 line is clearly detected, the profile just consisting in the central component.
Appendix A.4: Silicon sulphide (SiS)
We detected only one v = 0 rotational line of SiS, the J = 61–60 at 1102.029 GHz. The J = 104–103 at 1861.245 GHz is observed in setting 01, overlapping the vibrationally excited line of water at 1868.783 GHz, but it is very unlikely that we could have detected the SiS line since it has an upper state energy of 4723 K above the ground. No other v = 0 lines of SiS were observed, but several other rotational transitions of vibrationally excited states were covered by our survey. We did not detect any lines from states v = 2 and higher, but we tentatively detected two lines from the v = 1 levels: the J = 61–60 at 1096.635 GHz, and the J = 62–61 at 1114.431 GHz (this line has been also detected in OH 26.5+0.6, see Justtanont et al. 2012). In addition, we obtained significant upper limits for the v = 1 J = 55–54 and J = 64–63 transitions of SiS. The values obtained for the v = 1 J = 62–61 transition may be affected by the blending of this line with the v = 0 J = 26–25 line of 30SiO entering from the other side-band of the receiver, but they are very similar to the adjacent J = 61–60 line, which presents a clear detection. These two lines show just about half the strength of the v = 0 J = 61–60, even though they have an excitation energy of 2700 K, that is, 1600 K above the v = 0 line. This would suggest a relatively high excitation temperature between the v = 0 and v = 1 ladders due to the IR pumping of the v = 1 levels. However, the non-detection of the v = 1 J = 55–54 and J = 64–63 transitions suggests that the strength of the two detected v = 1 lines may also be enhanced by an IR line overlap.
Appendix A.5: Hydrogen cyanide (HCN)
We detected all the observed rotational transitions of HCN from the ground vibrational state: the J = 7–6, 13–12, and 20–19 lines, with Eupp/k of 119, 387, and 893 K. We also detected, although tentatively in some cases, all the HCN rotational lines within our bands from the vibrationally excited states v2 = 1 and v2 = 2: the J = 7–6, 13–12, and 20–19 l = 1e transitions of the v2 = 1 state, and the v2 = 1 J = 11–10 l = 1f and v2 = 2 J = 11–10 l = 2e lines. Two other lines from the v1 = 1 and v3 = 1 states were also observed, but were not detected.
The profiles of all these lines show only the central component. Including the data for vibrationally excited transitions, we found a noisy trend when plotting the FWHMs of the lines against the excitation energy of the upper levels. Lines with relatively low excitation energy, for instance, the v = 0 J = 7–6, show FWHM values higher than 40 km s-1, while values lower than 20 km s-1 are found for transitions with ≥Eupp/k of 1500 K. This result suggests that the vibrationally excited lines of HCN arise from the inner regions of the envelope where the final expansion velocity has not been attained yet.
The rotational diagram for HCN shows excitation temperatures between 90 and 250 K for the v = 0 lines, and of about 200 K for the v2 = 1 lines (Fig. A.1). If we compare similar rotational transitions in different vibrational states, we obtain excitation temperatures of 210–350 K between the v = 0 and v2 = 1 ladders (and of 1500 K between the v2 = 1 and v2 = 2 ladders, but this a very tentative result). This would suggest, although less clearly than in the cases of H2O, SiO, and SO, that the excitation of the v2 = 1 and 2 levels in HCN is also dominated by the IR radiation pumping.
We also systematically searched for lines of H13CN in our spectra, both from the ground and the v2 = 1 states. We detected the v = 0 J = 8–7 and (tentatively) the J = 14–13 lines, with Eupp/k of 145 and 435, respectively. No vibrationally excited lines were detected in our data, which include the frequencies of the v2 = 1 J = 7–6 and J = 8–7 transitions. Because of the severe blending of the v = 0 J = 14–13 line (it is at the edge of the strong 42,2–41,3 line of para-H2O), the results from the rotational diagram of H13CN can only be considered as tentative. We derive
an excitation temperature of about 90 K, very similar to the value for HCN between similar transitions, suggesting that the lines from both species are optically thin.
Appendix A.6: Phosphorous nitride (PN)
In addition to NH3 and HCN, the other N-bearing molecule identified in VY CMa in our HIFI spectra is PN. We detected the only two (ground-vibrational state) rotational lines covered by our observations, the N = 13–12 and 16–15 multiplets (six unresolved components within 4 MHz), with upper level energies of 205 and 307 K above the ground. The lines are relatively narrow, with FWHPs of less than 20 km s-1, suggesting that the emission originates in the inner shells of the envelope. The excitation temperature derived from the rotational diagram is about 220 K. Two v = 1 multiplets, the N = 12–11 and 25–24 at 559.7 and 1164.4 GHz, were also observed but were not detected, the limits are irrelevant.
Appendix A.7: Unassigned spectral features
There are three spectral features in our spectra that we were unable to unambiguously assign to any molecular line. They are listed in Table A.3 and are marked “U” in green in Fig. B.1. For the two in settings 13 and 14, 29SiS is a good candidate. For the other U-line in setting 11, the most likely candidate is 33SO (JN = 1818–1717 at 766.263 GHz). In other HIFISTARS observations, the U-features in settings 13 and 14 are also detected in C-rich envelopes, whereas that in setting 11 seems to be present in other O-rich sources, which would support our conjectures.
Appendix B: Full Herschel/HIFI WBS spectra
Here we present the full-bandwidth results of our Herschel/HIFI WBS observations of VY CMa. In Fig. B.1 we show the results for LO frequencies of 1102.9 GHz and lower: these are, from bottom to top, settings 14, 13, 12, 17, 11, 10, 09, and 08. In Fig. B.2 we show the results for LO frequencies of 1106.9 GHz and higher: these are, from bottom to top, settings 07, 06, 05, 04, 03, 19, 16, and 01. The Tmb observed with HIFI/WBS is plotted vs. both LSB (lower x-axis) and USB (upper x-axis) rest-frequency scales (in GHz), assuming an LSR systemic velocity of 22 km s-1 for the source. The location of the detected lines from the LSB/USB is indicated by the red and blue arrows and labels. The point of the arrow marks the appropriate axis in each case. Unassigned features are labelled “U” in green, and arrows point to the two possible rest frequencies. We note that setting 16 was observed twice using a slightly different LSR velocity for the source; since we cannot average these two spectra simultaneously aligning the two (side-band) frequency scales, in Fig. B.2 we only show the result for OBSID 1342196570.
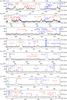 |
Fig. B.1
Full WBS bandwidth HIFI results for VY CMa for LO frequencies of 1102.9 GHz and lower. Quantum numbers for SO2 transitions are not given for clarity. |
| Open with DEXTER | |
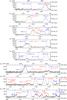 |
Fig. B.2
Full WBS bandwidth HIFI results for VY CMa for LO frequencies of 1106.9 GHz and higher. Quantum numbers for SO2 transitions are not given for clarity. |
| Open with DEXTER | |
© ESO, 2013
Current usage metrics show cumulative count of Article Views (full-text article views including HTML views, PDF and ePub downloads, according to the available data) and Abstracts Views on Vision4Press platform.
Data correspond to usage on the plateform after 2015. The current usage metrics is available 48-96 hours after online publication and is updated daily on week days.
Initial download of the metrics may take a while.