Fig. A.1
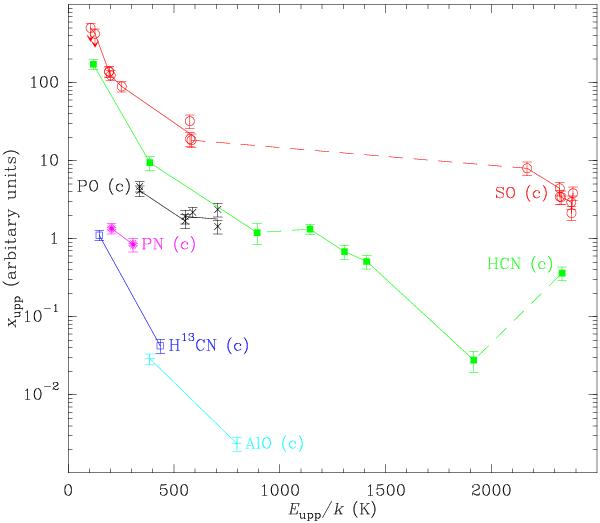
Rotational diagrams for some of the species discussed in this appendix: central component (c) only. Upper limits are marked with downward arrows. Solid lines join upper levels in the same vibrational state, while dashed lines join upper levels in different vibrational states.
Current usage metrics show cumulative count of Article Views (full-text article views including HTML views, PDF and ePub downloads, according to the available data) and Abstracts Views on Vision4Press platform.
Data correspond to usage on the plateform after 2015. The current usage metrics is available 48-96 hours after online publication and is updated daily on week days.
Initial download of the metrics may take a while.