Fig. 11
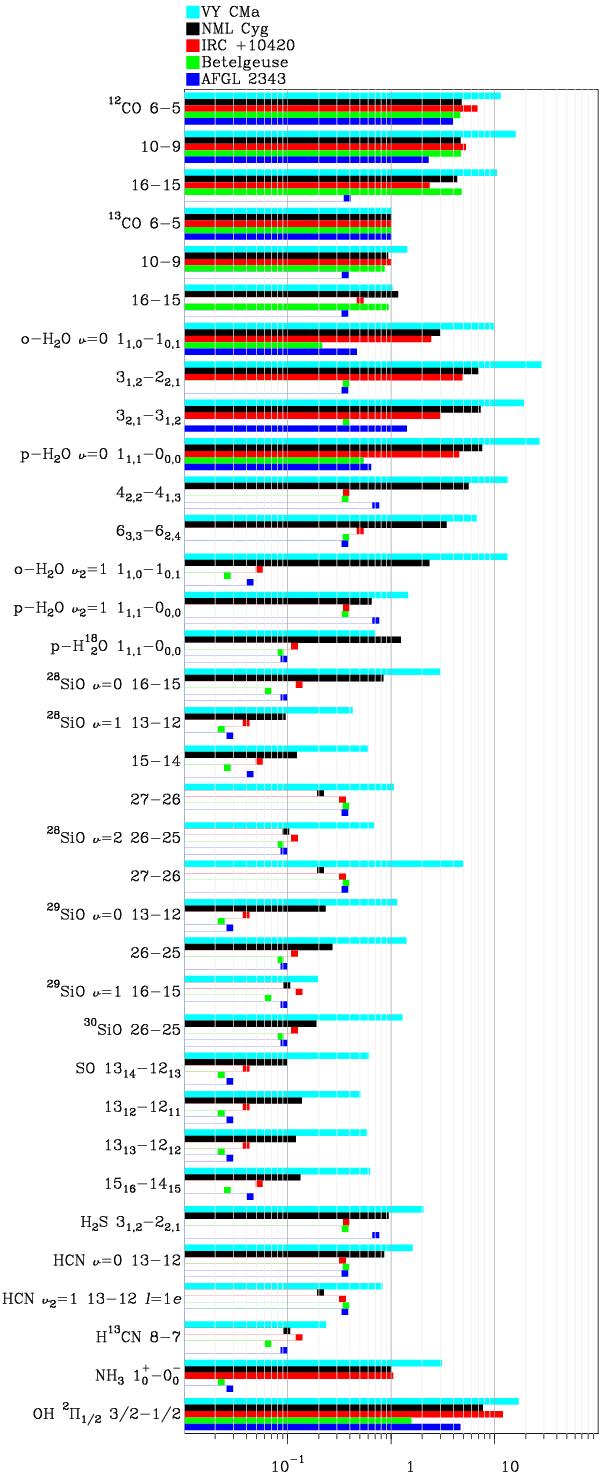
Comparison of the integrated emission of different lines in HIFISTARS for VY CMa and the other four hyper- and super-giants in the project (see Teyssier et al. 2012). For each object, the integrated intensities of the different lines have been normalized to that of its J = 6–5 13CO transition. Horizontal bars and small squares show, respectively, values and upper limits for detected and undetected lines. See Sect. 4.2 for more details.
Current usage metrics show cumulative count of Article Views (full-text article views including HTML views, PDF and ePub downloads, according to the available data) and Abstracts Views on Vision4Press platform.
Data correspond to usage on the plateform after 2015. The current usage metrics is available 48-96 hours after online publication and is updated daily on week days.
Initial download of the metrics may take a while.