Fig. 6
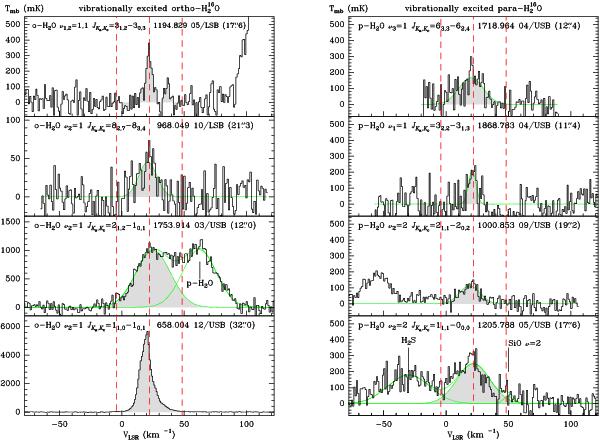
Same as Fig. 3 for the detected lines of vibrationally excited water. Note the narrow profile of the v2 = 1 JKa,Kc = 11,0–10,1 line in the bottom-left panel, indicating its maser origin. This may also be the case of the v1,2 = 1,1 JKa,Kc = 31,2–30,3 line in the top-left panel.
Current usage metrics show cumulative count of Article Views (full-text article views including HTML views, PDF and ePub downloads, according to the available data) and Abstracts Views on Vision4Press platform.
Data correspond to usage on the plateform after 2015. The current usage metrics is available 48-96 hours after online publication and is updated daily on week days.
Initial download of the metrics may take a while.