| Issue |
A&A
Volume 550, February 2013
|
|
|---|---|---|
| Article Number | A46 | |
| Number of page(s) | 10 | |
| Section | Interstellar and circumstellar matter | |
| DOI | https://doi.org/10.1051/0004-6361/201219983 | |
| Published online | 23 January 2013 | |
CH3OCH3 in Orion-KL: a striking similarity with HCOOCH3⋆
1
Univ. Bordeaux, LAB, UMR 5804, 33270 Floirac France
e-mail: This email address is being protected from spambots. You need JavaScript enabled to view it.
; This email address is being protected from spambots. You need JavaScript enabled to view it.
; This email address is being protected from spambots. You need JavaScript enabled to view it.
2
CNRS, LAB, UMR 5804, 33270
Floirac,
France
3
Department of Physics and Astronomy, University of
Århus, Ny Munkegade
120, 8000
Århus C,
Denmark
e-mail: This email address is being protected from spambots. You need JavaScript enabled to view it.
4
National Radio Astronomy Observatory, 520 Edgemont Road, Charlottesville, VA
22903-2475,
USA
e-mail: This email address is being protected from spambots. You need JavaScript enabled to view it.
; This email address is being protected from spambots. You need JavaScript enabled to view it.
5
Naval Research Laboratory, Code 7210, Washington, DC
20375,
USA
e-mail: This email address is being protected from spambots. You need JavaScript enabled to view it.
6
Observatoire de Paris, LERMA, CNRS, 61 Av. de l’Observatoire,
75014
Paris,
France
e-mail: This email address is being protected from spambots. You need JavaScript enabled to view it.
7
Laboratoire de Physique des Lasers, Atomes et Molécules,
Université de Lille1, UMR 8523, 59655 Villeneuve d’ Ascq
Cedex, France
e-mail: This email address is being protected from spambots. You need JavaScript enabled to view it.
Received: 11 July 2012
Accepted: 3 December 2012
Abstract
Context. Orion-KL is a remarkable, nearby star-forming region where a recent explosive event has generated shocks that could have released complex molecules from the grain mantles.
Aims. A comparison of the distribution of the different complex molecules will help in understanding their formation and constraining the chemical models.
Methods. We used several data sets from the Plateau de Bure Interferometer to map the dimethyl ether emission with different arcsec spatial resolutions and different energy levels (from Eup = 18 to 330 K) to compare with our previous methyl formate maps.
Results. Our data show remarkable similarity between the dimethyl ether (CH3OCH3) and the methyl formate (HCOOCH3) distributions even on a small scale (1.8″ × 0.8″ or ~500 AU). This long suspected similarity, seen from both observational and theoretical arguments, is demonstrated with unprecedented confidence, with a correlation coefficient of maps ~0.8.
Conclusions. A common precursor is the simplest explanation of our correlation. Comparisons with previous laboratory work and chemical models suggest the major role of grain surface chemistry and a recent release, probably with little processing, of mantle molecules by shocks. In this case the CH3O radical produced from methanol ice would be the common precursor (whereas ethanol, C2H5OH, is produced from the radical CH2OH). The alternative gas phase scheme, where protonated methanol CH3OH is the common precursor to produce methyl formate and dimethyl ether through reactions with HCOOH and CH3OH, is also compatible with our data. Our observations cannot yet definitely allow a choice between the different chemical processes, but the tight correlation between the distributions of HCOOCH3 and CH3OCH3 strongly contrasts with the different behavior we observe for the distributions of ethanol and formic acid. This provides a very significant constraint on models.
Key words: astrochemistry / ISM: molecules / radio lines: ISM / ISM: individual objects: Orion-KL
Based on observations carried out with the IRAM Plateau de Bure Interferometer. IRAM is supported by INSU/CNRS (France), MPG (Germany) and IGN (Spain).
© ESO, 2013
1. Introduction
The Orion protocluster region is the closest high mass star formation region to the Sun. We adopt a distance of 414 ± 7 pc (Menten et al. 2007), consistent within the error bars with the values of 389 pc of Sandstrom et al. (2007), 437 pc of Hirota et al. (2007) and 419 pc of Kim et al. (2008). This region is remarkable because of the presence of high speed shocks which appear to be generated in the center of the Kleiman-Low infrared nebula Orion-KL. These are reminiscent of a past explosive event and are most clearly seen in the H2 2.12 μm emission (Allen & Burton 1993). From VLA proper motion measurements of two strong centimetric radiosources, it was proposed that a very unique phenomenon had taken place some 500–1000 years ago: the close encounter, or collision, of two or more rather massive stars. The objects involved in such a dynamical interaction could have included the Becklin-Neugebauer object (BN) and sources I and n (Gómez et al. 2005; Rodríguez et al. 2005; Goddi et al. 2011; Nissen et al. 2012). Traces of this explosive pattern have recently been observed in the CO distribution by Zapata et al. (2009).
This very recent and energetic event at the heart of the nebula provides unique conditions for the study of a rich interstellar chemistry. Many molecules could have been released from the grain mantles because of dust heating or sputtering by multiple shocks, especially the relatively large molecules for which no gas – phase – only formation route is satisfactory.
Main parameters of the IRAM Plateau de Bure interferometer data sets where transitions of dimethyl ether are detected.
From a set of twelve Plateau de Bure observations, we have recently analyzed the deuterated methanol isotopologues CH2DOH and CH3OD (Peng et al. 2012) and the methyl formate HCOOCH3 (Favre et al. 2011a) emission in Orion KL. The latter work suggests a rather close morphological relation in several places of the Orion KL nebula between excited H2 emission at 2.12 μm and methyl formate.
Even though both methyl formate and dimethyl ether are oxygen-bearing molecules of medium complexity and both can be produced from gaseous methanol (e.g. Peeters et al. 2006) and/or from grain surface chemistry (e.g. Garrod et al. 2008), these two species are spectroscopically different, and their spectra behave differently with physical temperature. Furthermore, since the early days of dimethyl ether studies (Snyder et al. 1974; Clark et al. 1979) there was a hint of limited departures from LTE for dimethyl ether. Recently, we have carried out observations at the EVLA of the J(K-1, K + 1) = 6(1,5)−6(0,6) EE transition of dimethyl ether at 43.4475415 GHz (Favre et al. 2011b) which shows that the distribution is very similar to that of methyl formate.
In this paper we present the analysis of several dimethyl ether lines present in our Plateau de Bure data set. The maps of the CH3OCH3 emission at different frequencies and energy levels are shown in Sect. 3. In Sect. 4 we compare the spectra at the five main emission positions to synthetic spectra based on the temperatures derived from our previous methyl formate analysis. Finally, we discuss in Sect. 5 the similarity in spatial structure and velocity between our high resolution maps of dimethyl ether and methyl formate and examine its implication on the different chemical models of formation of these species, in particular in comparison also with our ethanol and formic acid maps.
2. Observations
The data set consists in twelve data cubes obtained with the IRAM Plateau de Bure Interferometer, the parameters of which are presented in Favre et al. (2011a; see their Table 1). We used the GILDAS package1 for data reduction. The continuum emission was subtracted in the data cubes by selecting line-free channels as judged by careful visual inspection, discarding any contaminated channels. Finally, we cleaned the data cubes, channel by channel, using the Clark method (Clark 1980).
Table 1 presents the parameters of the four cubes where transitions of dimethyl ether are detected. Spatial resolution ranges from 1.79″ × 0.79″ to 7.63″ × 5.35″ and spectral resolution from 0.84 to 2.33 km s-1.
Detected and blended transitions of dimethyl ether observed with the Plateau de Bure Interferometer toward Orion-KL.
3. Dimethyl ether (CH3OCH3) frequencies and maps
3.1. Dimethyl ether frequencies
The data set includes several dimethyl ether (DME) lines. Table 2 lists the DME transitions, present in our data and detected or blended, taken from the CDMS database2 (Müller et al. 2001, 2005) up to Eupper ≲ 650 K and based on the recent work of Endres et al. (2009). The non detected transitions correspond to lines too faint to be detected (Sμ2 ≥ 6.5 for the detected transitions and Sμ2 ≤ 4.1 for non detected). The detected transitions cover the energy range 19 to 330 K.
Dimethyl ether is an asymmetric top molecule with two equivalent methyl groups undergoing large amplitude motions along the CO-bond. The two internal rotations cause a splitting of each rotational level into four substates AA, EE, EA, and AE (see Sect. 4 for line strengths and frequency separation of the multiplets).
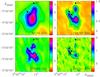 |
Fig. 1 Dimethyl ether integrated intensity maps obtained with the Plateau de Bure Interferometer: these panels show the sum of the emission of the transitions at 80.54 GHz, 101.56 GHz, 203.42 GHz and 223.41 GHz. The first contour and the step are 0.5 Jy/beam, 0.2 Jy/beam, 2 Jy/beam and 0.3 Jy/beam at 80.54 GHz, 101.56 GHz, 203.42 GHz and 223.41 GHz respectively. Note that the 203.42 GHz transitions are blended with the H |


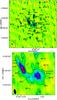 |
Fig. 2 Dimethyl ether integrated intensity maps obtained with the Plateau de Bure Interferometer (sum of emission at 223.409 GHz and 223.412 GHz between 5 and 12 km s-1). The bottom image is a blowup of the Hot Core/Compact Ridge map area. The beam is 1.79″ × 0.79″; the level step and first contour are 3.8 K km s-1. The position of the millimeter source MM23 (Eisner et al. 2008) is also indicated. The main different HCOOCH3 emission peaks identified in Favre et al. (2011a) are marked by a cross and labeled MFNUMBER. Note that the dimethyl ether distribution is very similar to that of methyl formate (cf. Fig. 4 in Favre et al. 2011a, and see Sect. 5.1.1). |
3.2. The dimethyl ether emission maps
The maps of the dimethyl ether molecule, CH3OCH3, allow us to trace the spatial distribution of one major oxygenated molecule in Orion-KL. Figure 1 shows the CH3OCH3 emission measured at different wavelengths; note the different angular resolutions of the various data sets (listed in Table 1). The distribution shows the same extended, V-shaped molecular emission linking the radio source I to the BN object as previously observed in methyl formate (Favre et al. 2011a). The highest spatial resolution map at 223.41 GHz (1.79″ × 0.79″) is presented in Fig. 2. We have marked the Hot Core and Compact Ridge positions (see e.g. Beuther et al. 2005). The position of the main emission peaks identified in methyl formate, labeled MF1 to MF28, are indicated. Most of these correspond to the dimethyl ether peaks as well within the beam size.
The distribution of CH3OCH3 appears very similar to the distribution of HCOOCH3 in the velocity range where the main component lies between 6 and 9 km s-1 and a north-south linear structure shows up at higher velocities (9–12 km s-1).
The relative intensities of the different spatial emission peaks depend on the upper state energy of the transitions. Figure 3 shows the CH3OCH3 emission for transitions with different energy levels ranging from Eup = 18 to 330 K. The 43.47 GHz map is that obtained with the EVLA (Favre et al. 2011b). As previously observed for the methyl formate in Favre et al. (2011a), the emission of dimethyl ether at the MF2 position (“Hot Core SW” in Friedel & Snyder 2008) becomes stronger at higher energy levels.
The comparison of our interferometric spectrum at 101.56 GHz to the single-dish spectrum taken with the IRAM 30 m (J. Cernicharo, priv. comm.) shows that little flux is missing due to filtering on a 3″ scale (see Fig. 4).
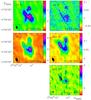 |
Fig. 3 CH3OCH3 intensity maps integrated in velocity between 5 and 12 km s-1. The line frequency and the upper state energy are indicated on each plot. The CH3OCH3 43.47 GHz map was obtained with the EVLA (Favre et al. 2011b). The dimethyl ether emission is stronger towards the compact ridge than the hot core SW position for low upper energy transitions, while the opposite is the case for high upper state energies. |
4. Temperatures and column densities
The four torsional forms AA, EE, AE and EA have weights of 6:16:2:4 for ee, oo levels and 10:16:4:6 for eo and oe levels (Turner 1991; Lovas et al. 1979). Most of the time the spectral resolution of the radiotelescopes does not allow separation of the AE and EA transitions, so that a symmetrical triplet is observed. In that case and if the lines are optically thin, the observed dimethyl ether triplet (AA, EE, AE+EA) should then be either 6:16:6 or 10:16:10 in relative intensity. For part of the triplet observed at the edge of the bandwidth at 223.4 GHz we find a ratio of 1:2.7:1 within the errors. This is in agreement with a low optical depth. However for the transitions at 80.53 GHz, the EE line in the middle is much too weak with respect to the other lines. This EE line is stronger in the spectra taken with single-dish radiotelescopes (Johansson et al. 1985; Turner 1989), so that this could be caused by an observational rather than an excitation effect.
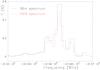 |
Fig. 4 Dimethyl ether spectrum at 101.56 GHz observed with the IRAM 30 m radiotelescope (in black, J. Cernicharo, priv. comm.) overlaid on the PdBI spectrum convolved to the same spatial resolution (in red). |
For the transitions at 101.56, 203.42 and 223.41 GHz, we have produced synthetic spectra assuming local thermodynamic equilibrium (LTE), using the line parameters derived from our methyl formate analysis toward the five main emission peaks whose positions are given in Table 3. We first used the HCOOCH3 velocity v, line width Δv1/2 and temperature Trot to derive the NCH3OCH3 column density; then we have slightly adjusted the parameters for a better fit of the dimethyl ether spectra. This was done with our own routines and XCLASS3. Figure 5 shows synthetic spectra overlaid on the observed spectra and Table 4 lists the parameters for the angular resolutions of the 101 GHz (3.63″ × 2.26″) and 223 GHz (1.79″ × 0.79″) observations. The parameters used for the 203 GHz observations (angular resolution of 2.94″ × 1.44″) are intermediate values. The calculated opacities (estimated from the ratio of the brightness temperature to the rotational temperature) are generally less than 0.2 and at most 0.4 at MF1.
Positions of the main HCOOCH3 emission peaks observed with the Plateau de Bure Interferometer toward Orion-KL as identified in Favre et al. (2011a).
We derived abundances relative to methanol using the column densities of Peng et al. (2012). We find values between 0.05 and 0.2. This result assumes that both gas components are coextensive and in LTE at the same temperature, which might be questionable if the difference in the derived temperature between dimethyl ether and methanol is significant. This question is related to the dimethyl ether formation route and is discussed later in Sect. 5.
CH3OCH3 synthetic spectra parameters (velocity, line width, beam-averaged temperature and column density) which reproduce best the PdBI spectra at the emission peaks MF1 to MF5 for the angular resolutions of the 101 GHz (3.63″ × 2.26″) and 223 GHz (1.79″ × 0.79″) observations.
5. Discussion
5.1. Similarity of dimethyl ether and methyl formate HCOOCH3 maps
Most maps of molecular emission in Orion KL obtained in previous studies show a huge diversity in morphology. On the contrary we show here the very striking similarity which appears between our high resolution maps of dimethyl ether and methyl formate (Favre et al. 2011a). The high degree of correlation we find reinforces the need to explain the similarity already noted between these species in previous studies, and probably points towards a similarity of their formation paths, with a common precursor for both species.
First we present the correlation of dimethyl ether with methyl formate observed in this work and previous results for these molecules. We then briefly review the models of gas phase and/or ice mantle chemistry proposed to form these species, concentrating on the most recent works (Laas et al. 2011; Neill et al. 2011; Bisschop et al. 2007; Öberg et al. 2009, 2010) and examine the compatibility of various hypotheses with the present data, as well as with our ethanol and formic acid maps made from the present data set.
5.1.1. PdBI maps and correlation diagrams
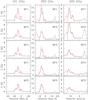 |
Fig. 5 CH3OCH3 synthetic spectra (in red) overlaid on the observed spectra toward the MF1 to MF5 positions. The 101 GHz, 203 GHz and 223 GHz observations are in the left, middle and right columns respectively. The observed spectrum at 223 GHz is at the edge of the bandwidth. |
When we compare the dimethyl ether map with the methyl formate map obtained with the same data set and from transitions with close Eu energies (Fig. 6), these show a striking overall similarity: 1) both molecules are present in the 6–11 km s-1 velocity range and show no detectable emission at 5 km s-1, 2) both molecules show a general V-shaped distribution, 3) they both have their strongest peak at the Compact Ridge for transitions of low Eu energy range (MF1 position), 4) they both have a second peak (MF2 position) at the position named Hot Core SW by Friedel & Snyder (2008), a few arcseconds below the continuum Hot Core peak, and which is stronger than MF1 for high Eu energy range transitions (see Sect. 3.2), 5) they both have a northern extension toward BN around 10 km s-1, 6) many other secondary peaks are similar.
The correlation between the two maps is however not 100%. Faint emission is present for both species but differ somewhat in shape at other places or is displaced by 1–2″. One should note however the influence of the cleaning procedure necessary to reconstruct the distribution.
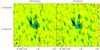 |
Fig. 6 Comparison of the methyl formate map (left) at 223.534 GHz (Eu = 305 K) and the dimethyl ether map (right) at 223.41 GHz (Eu = 330 K). The transitions are from the same data cube and the 1.79″ × 0.79″ beam is plotted in the bottom left corner. |
The similarity between dimethyl ether and methyl formate maps can be displayed in a more quantitative way. In Fig. 7 the intensity of each pixel of the dimethyl ether emission line (Eu = 330 K) at 223.41 GHz and methyl formate emission line (Eu = 305 K) at 223.534 GHz are compared (note that there is some correlation between pixels since the pixel size is about 3 times smaller than the synthesized beam). The correlation coefficient of Bravais-Pearson is 0.8. By contrast we show the same type of diagram with formic acid HCOOH (10(2, 9)−9(2, 8) transition at 223.915 GHz with Eu = 72 K) compared to the methyl formate transition at 223.500 GHz (11(4, 8)−10(3, 7), Eu = 50 K) and ethanol C2H5OH (23(7, 17)−23(6, 17), vt = 0−1 transition at 223.629 GHz with Eu = 346 K) compared to the methyl formate transition at 223.534 GHz (18(5, 14)−17(5, 13), Eu = 305 K), for which the correlation coefficients are only 0.32 and 0.19 respectively. For reference, we also show the correlation of 2 transitions of methyl formate with same energy (223.465 GHz and 223.500 GHz with Eu = 50 K); the correlation coefficient is 0.82 – the methyl formate/dimethyl ether result is almost as high. The correlation of 2 transitions of methyl formate with different energies (223.465 GHz and 223.534 GHz with Eu = 50 K and 305 K, respectively) is not as good (correlation coefficient of 0.76) due to differences in excitation which are apparent in Fig. 3 and in Favre et al. (2011a, see their Fig. 15). The estimated opacity for all the above transitions is less than 0.15, so that there is no noticeable optical depth effect.
This similarity of the dimethyl ether map with the methyl formate map is not observed with other species (see e.g. Guélin et al. 2008, and our Fig. 8 for formic acid HCOOH).
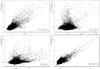 |
Fig. 7 Plot of the intensity of pixels in the methyl formate maps versus the intensity of the same pixels in the dimethyl ether (top left), ethanol (top right), formic acid (bottom left) and methyl formate (bottom right) maps. Care has been taken to use transitions with similar Eu energies. The methyl formate (Eu = 305 K) at 223.534 GHz is compared to the dimethyl ether transition (Eu = 330 K) at 223.41 GHz and to the ethanol transition (Eu = 346 K) at at 223.629 GHz. The methyl formate transition (Eu = 50 K) at 223.500 GHz is compared to the formic acid transition (Eu = 72 K) at 223.915 GHz and to the methyl formate transition (Eu = 50 K) at 223.465 GHz. Dimethyl ether shows clearly the highest spatial correlation with methyl formate. |
5.1.2. Dimethyl ether and methyl formate behavior in previous publications
The similarity in the distribution between the two species has also been seen in single dish studies of Orion and of other regions. In Table 5 we selected only some of the numerous Orion KL line surveys based on two factors: 1) early papers from which the parallel between some species so called “compact ridge species”, and in some cases already the parallel dimethyl ether/methyl formate distribution, was progressively recognized with increasing evidence, and 2) papers providing the best line profile parameters, temperatures and column densities for both dimethyl ether and methyl formate.
Dimethyl ether and methyl formate parameters from previous single-dish studies.
When we convolve our PdBI dimethyl ether data to a typical single-dish field of view of 30″, the spectra can be relatively well fitted with one component of temperature Trot ~ 90 K and column density NCH3OCH3 ~ 0.6 × 1016 cm-2.
Using  to convert the column density of molecule X (averaged over a beam of diameter θ) into a mass MX (in solar mass M⊙), we find for dimethyl ether (μX = 46): MDME ~ 8.6 × 10⁻⁶ M⊙, or about 2.8 MEarth.
To better compare our results with the single dish studies, we have computed the dimethyl ether mass in each case, and we display the value, R, relative to our result, in Col. 9 of Table 5. All values are within a factor of two with respect to ours except in the case of the Lee & Cho (2002) observations. No trend is seen with respect to the beam size, despite the large range of sizes; this implies that at least 50%, and perhaps almost all of the dimethyl ether seen in the ODIN wide beam (2.1′) is in fact contained in the inner 30″ which we have observed with the PdBI. There is no noticeable effect either related to the range of upper level Eu used in the various studies.
The parallel between both molecules is especially striking on small scales in the present PdBI data. Previous interferometric papers showed some hints of this tendency. Minh et al. (1993) present the first HCOOCH3 and CH3OCH3 maps, made with the NMA (5 2 × 42 resolution); they noted that the difference between the emission distributions of the two molecules may be due to the 100 K difference in upper energy of the observed transition levels. Blake et al. (1996) with OVRO at 1.3 mm (15 × 10 synthesized beam, and 1 MHz = 1.3 km s-1 spectral resolution) observed 18 species including methanol, methyl formate and dimethyl ether. No maps are shown for dimethyl ether, but there is a general trend to behave somewhat like HCOOCH3, CH3OH, H2CS and H2CO. Beuther et al. (2005, 2006) show many maps obtained with the SMA at 0.86 mm and 0.44 mm of O-bearing species including dimethyl ether, methanol and methyl formate, but at different excitation levels and there is only a partial similarity of the maps. In their CARMA observations at 1.3 mm (25 × 085), Friedel & Snyder (2008) observed both dimethyl ether (transition at Eu = 81 K) and methyl formate (transition at Eu = 120 K). The maps of the two species did not match perfectly, one peaking at IRc5 and the other at IRc6, but the CH3OCH3 line is blended and a blend with an N-bearing molecule would explain the observed strong emission at IRc6 and the Hot Core SW. Note also that no methyl formate is attributed to the Compact Ridge (while it is the strongest methyl formate peak in Favre et al. 2011a); but these authors define the Compact Ridge position differently. The correlation is very clear in Fig. 3 of Neill et al. (2011) from their CARMA observations; the 61 × 50 resolution is however insufficient to clearly separate the emission from the many individual methyl formate peaks.
5.1.3. The abundance correlation of dimethyl ether with methyl formate
Another important input is the value of the relative dimethyl ether/methyl formate abundances. Table 6 lists the abundances derived at the main positions in our maps for dimethyl ether with respect to methyl formate. Dimethyl ether is about 3–4 times more abundant than methyl formate towards MF3, MF4 and MF5.
Several hypotheses can be considered to explain this correlation:
-
Dimethyl ether and methyl formate would emit at the samelocation because of a similar excitation of the transitions, i.e. asimilar behavior with respect to temperature, density or IRradiation field. But there is no special similarity in the levelstructure of dimethyl ether and methyl formate, especially ascompared to other complex organics like ethanol. Furthermore,the physical parameters are not uniform over Orion KL: thetemperature varies from 80 to 160 K for methylformate, which affects the dimethyl ether/methyl formate lineratio. The critical densities are ~105−8 cm-3 and ~104−7 cm-3 respectively, while nH2 varies from 104 to 108 cm-3. And the IR absorption bands are different, only the CH3-O bond is common.
-
These molecules are just undergoing sublimation at the same temperature. This is likely, but similar abundances in the ices are also required in that case.
-
The similar column densities reflect only the general structure of Orion KL. However dust and other molecules have different patterns.
This leaves a correlation of the molecular abundances in the gas phase as the most simple and likely explanation (see further discussion in Sect. 5.2).
CH3OCH3 abundance relative to HCOOCH3 at the emission peaks MF1 to MF5 for the angular resolutions of the 101 GHz (3.63″ × 2.26″) and 223 GHz (1.79″ × 0.79″) observations.
5.1.4. Dimethyl ether and methyl formate observations in other regions
Single dish observations of several other sources have also noted the parallel between these two species.
In their study of 7 massive hot core regions spread across the Galaxy, Bisschop et al. (2007) study the statistical correlation between the abundances of 13 organic molecules looking for evidence of grain surface chemistry. Methyl formate and dimethyl ether are mostly seen where Tdust is >100 K. A strong correlation is found between the abundances of H2CO, CH3OH, C2H5OH, HCOOCH3 and CH3OCH3 and the correlation is even >0.9 among the last three.
Comparing the results of Bisschop et al. (2007) with our findings, we note that 1) if dimethyl ether appears to be strongly correlated with methyl formate, the correlation they observed is similarly high with ethanol; 2) Trot has a large scatter among sources of dimethyl ether, and in some sources may be lower or higher than for methyl formate. Beyond possible observational uncertainties (noise and confusion), one should note the different scales of both studies: while we sample down to (1.79″ × 0.79″ or ~500 AU) in the nearby Orion region with the PdB interferometer, the single dish results of Bisschop et al. (2007) are average values for the whole region at Tdust > 100 K which is 1500–5300 AU in radius for their sources – the latter would correspond to a study of Orion over ~20″ in diameter, i.e most of the KL region. This would explain why ethanol is not distinguished from dimethyl ether and methyl formate, and the less tight correlation between dimethyl ether and methyl formate could be due to additional formation pathways/excitation conditions for a fraction of these species on a larger scale. In other words, the process of formation of methyl formate and dimethyl ether we observe in our case, probably linked to shocks, might not appear as “pure” and unique on a larger scale.
It is interesting to note that in a recent multi-species interferometric study of the young binary protostar IRAS16293, Jørgensen et al. (2011) have mapped CH3OCH3 and HCOOCH3. The two molecules appear to be similar, showing two small concentrations of similar intensity around the A and B source components.
An extensive study of O-bearing species was performed in the Galactic Center clouds by Requena-Torres et al. (2006, 2008) which led them to conclude to a “universal” mantle composition in the various GC clouds; this composition is different in hot corinos (Requena-Torres et al. 2006) and in Hot Cores (Requena-Torres et al. 2008). They relate the gas phase abundances of these complex organic molecules to sputtering or evaporation due to shocks, a situation similar to some extent to Orion KL. In the 2006 study, 7 lines of methyl formate and 2 of dimethyl ether were observed, with Eu/k in the same 20–40 K range; dimethyl ether was not observed in their 2008 study. Note that the rotational temperatures derived in the 2008 study are rather cold (<15 K). Due to the large distance of the GC clouds the sources they observe are likely more extended than what we observe in Orion. These authors do not put any emphasis on the dimethyl ether/methyl formate comparison, although the two molecules are noted to have similar abundances with respect to methanol. The grain surface scheme proposed (Fig. 9 in Requena-Torres et al. 2008) does not suggest any close relation between methyl formate and dimethyl ether.
5.2. Formation of dimethyl ether and methyl formate
5.2.1. Chemical models
Since detailed presentations can be found elsewhere (e.g. Peeters et al. 2006; Neill et al. 2011; Herbst & van Dishoeck 2009) we summarize here only briefly different models.
A first model of pure gas-phase ion-molecule chemistry was proposed (e.g. Blake 1988) where the protonated methanol ion, CH3 , produced both CH3OCH3 and HCOOCH3, through reactions with CH3OH and H2CO respectively, which naturally explained the suspected intimate chemical link between these species. However, a first difficulty for an interstellar chemistry model is to produce a sufficient amount of these complex species. The pure ion-molecule chemistry proved unable to produce the observed abundances. This led to suggest a role of surface chemistry and of the release of mantle molecules into the gas phase by some process. The models considered first injection of water, but injection of methanol itself, processed once in the gas phase by ion-molecule chemistry appeared to be required. A key species in this scheme remained protonated methanol CH3
 , and a close correlation of methyl formate and dimethyl ether was predicted (e.g. Charnley et al. 1995; Caselli et al. 1993). Most of the more complex species predicted to be abundant by the Charnley et al. (1995) model remain undetected, although one of these (not expected to be the most abundant one), ethyl formate HCOOC2H5, has recently been detected in Sgr B2 (Belloche et al. 2009). This ice mantle methanol release/gas-phase post-processing model could not produce enough methyl formate when calculations by Horn et al. (2004) showed that the reaction CH3 + H2CO was not possible at interstellar temperatures.
Presently there are two different proposals: 1) new gas-phase ion-molecule formation routes where formaldehyde is replaced by formic acid (e.g. Neill et al. 2011); 2) a direct formation of methyl formate and dimethyl ether on the grains (e.g. Garrod et al. 2008; Laas et al. 2011).
5.2.2. How do these models confront our Orion dimethyl ether and methyl formate data
In our view, the simplest and most natural explanation of the dimethyl ether-methyl formate correlation is the production of both species by a common precursor reacting with an abundant simple species such as either CH3OH, H2CO or HCOOH. However, we suggest another – less likely in our view – possibility: the convergence of the dimethyl ether and methyl formate abundances resulting from the long time evolution of many chemical reactions.
The common precursor hypothesis: CHO radical (solid phase) vs. CH3OH and CH3 (gas phase).
If solid phase chemistry dominates, the common precursor would be the CH3O radical, as detailed in Öberg et al (2010). In the scheme of UV irradiated ices, photodissociation of CH3OH leads to two radicals CH3O and CH2OH4. The former is the precursor of methyl formate and dimethyl ether which are formed respectively by reaction with HCO and CH3 on the grain. The other radical produced from methanol, CH2OH, leads to ethanol C2H5OH, ethylene glycol CH2OHCH2OH and glycolaldehyde CH2OHCHO. A strong prediction of this model would thus be that the 3 latter molecules should show a somewhat similar distribution, which is likely to be different from that of methyl formate and dimethyl ether. Different conditions, either in the pre-explosion phase (a preencounter role of BN, distance to the Trapezium, different heating, e.g. due to the proximity of source I), or after the explosive event (direct effect of the shock, or subsequent exposure to the photons of BN, even higher proximity of IR luminous source I) might explain the different importance of the CH2OH and CH3O molecules in the Hot Core and in the Compact Ridge. Indeed, our interferometric observations show a similar distribution for C2H5OH and CH2OHCH2OH but different from that of HCOOCH3 and CH3OCH3 (Guélin et al. 2008; Brouillet et al., in prep.); however, CH2OHCHO is not detected (Favre et al. 2011a). Note that some conversion mechanisms between CH2OH and CH3O are suggested by Cernicharo et al. (2012) in their CH3O detection paper.
If the molecules would be mainly produced in the gas phase, methyl formate could be produced from formic acid as suggested by Neill et al. (2011): the anti-correlation observed between HCOOH and HCOOCH3 across most of the Orion-KL region (see Fig. 8) is consistent with their model of recent gas-phase conversion. Two ion-molecule reactions involving the reaction of methanol and formic acid, where one of the reactants is protonated, could be viable interstellar reaction routes to form methyl formate. Either the methanol, CH3OH, or the protonated methanol, CH3, would then be the common precursor to methyl formate and dimethyl ether. Indeed, the reaction between protonated methanol and neutral methanol produces protonated dimethyl ether and is considered as an important contributor to interstellar dimethyl ether formation. If methyl formate is efficiently produced in a region by the reaction between HCOOH and CH3, dimethyl ether is produced as well in the same spatial region, since neutral methanol is also present. A prediction of these reactions is the presence of the less stable t-HCOOCH3, which is not yet detected in Orion, and the anticorrelation with HCOOH, consumed by the reaction. Another interesting test would be to detect directly CH3, once its millimetric spectrum is known.
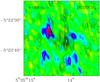 |
Fig. 8 Methyl formate channel map (black contours) at 8 km s-1 (sum of the transitions at 223.465 and 223.500 GHz, Eu = 50 K) overlaid on the formic acid channel map (colors) at the same velocity for the 223.915 GHz transition (Eu = 72 K). All data are taken from the same data set (1.79″ × 0.79″ resolution). |
Methanol maps (see maps in Peng et al. 2012, from the same data set) are somewhat different. Despite the fact methyl formate and dimethyl ether are chemically related to CH3OH, their distributions are not expected to correlate as tightly with methanol as with each other since: i) in the gas phase production scheme, the methyl formate/dimethyl ether precursor CH3 can be produced with an efficiency varying across Orion-KL. In addition CH3OH, as the parent species, is partly consumed to some extent (5–20%) to form methyl formate and dimethyl ether (and could have other reactions); ii) in the ice mantle production scheme, some layering of the mantle is expected (see e.g. Herbst & van Dishoeck 2009), and only a fraction of solid methanol closest to the surface can be processed by UV.
We suggest, however, another possibility which could be investigated for the gas-phase chemistry. Because the main problem to form HCOOCH3 from CH2 and H2CO is an energy barrier, could this obstacle be removed if one considers that the ions are strongly accelerated with respect to neutrals at some places of an MHD shock? A few km s-1 would represent enough kinetic energy to overcome the reaction barrier, which is 128 kJ/mol (15 000 K or 1.2 eV) according to Horn et al. (2004). New quantum calculations and/or laboratory work are required to test this hypothesis.
An alternative hypothesis could be: convergence of methyl formate and dimethyl ether abundances with time. We cannot exclude the convergence with time of the chemical network to a same methyl formate/dimethyl ether ratio value for a large range of initial conditions and parameters. (Note that such a convergence is not always present; for instance chemical systems may oscillate.) No common precursor is needed in this case. The convergence should be achieved in a time short enough (at least <1–10 Myr, the probable maximum age of molecular clouds in OMC 1). This hypothesis is less likely in our view (cf. the probable consequences of recent shocks).
6. Conclusions
We have studied the distribution of the complex O-bearing molecule dimethyl ether CH3OCH3 at medium and high angular resolution (6.5″–1″) using various sets of interferometric data from the IRAM Plateau de Bure Interferometer. Our main results and conclusions are the following:
-
1.
This data set includes 4 well detected lines fromEu = 19 K to Eu = 330 K and other partially blended or blended lines.
-
2.
The most intense emission arises from the Compact Ridge at the methyl formate peak position (MF1, Favre et al. 2011a); the second most intense at the Hot Core SW position (Friedel & Snyder 2008) or MF2 (Favre et al. 2011a).
-
3.
We have used the temperature derived from our previous methyl formate study for the five main peaks and we have deduced CH3OCH3 column densities assuming LTE. Temperatures cover the range 80 to 170 K, and column densities 1.5 × 10¹⁶ to 3.5 × 1017 cm-2.
-
4.
The abundance of CH3OCH3 relative to methanol, CH3OH, is in the range 0.05 to 0.2 depending on the positions and assuming identical spatial distribution and temperature for both molecules. When observed on the same spatial scale of 3.6″ × 2.3″, the abundance of CH3OCH3 relative to methyl formate, HCOOCH3, is in the range 3.5 to 9.
-
5.
We observe a very good correlation of the spatial distribution of the methyl formate and dimethyl ether emission. We show that it is most likely due to a correlation of their abundances.
-
6.
The dimethyl ether emission follows the 2.12 μm H2 distribution, as does the methyl formate distribution. Shocks seem to be related to the presence of these species, possibly because of the release of molecules from grain mantles.
-
7.
A common precursor to dimethyl ether and methyl formate appears the simplest explanation to the observed correlation. In the gas phase, the precursor CH3
would react respectively with CH3OH and, as suggested by Neill et al. (2011), with HCOOH. The reaction of protonated methanol CH3 with H2CO and CH3OH is excluded by quantum calculations in normal interstellar conditions. We speculate whether the reaction of high speed CH3 ions (a few km s-1 to >20 km s-1) might change this conclusion. On the other hand, if methyl formate and dimethyl ether are already produced in the ice mantle, CH3OH and/or methoxy radical CH3O seem to be the common precursor. -
8.
We observe a different distribution of ethanol C2H5OH (and ethylene glycol CH2OHCH2OH, in prep.). In the grain mantle chemistry scheme this could result from different production rates or schemes of CH2OH vs. CH3O radicals across Orion-KL. Furthermore we confirm the anti-correlation of methyl formate with formic acid, HCOOH, found by Neill et al. (2011). This in favor of their model of production of methyl formate from gas phase HCOOH and CH3
where CH3 is formed from methanol released from grains.
High resolution mapping brings new insight to the comparison of complex organic molecules and the understanding of their formation. The HCOOCH3 and CH3OCH3 tight correlation, and the different behavior of ethanol we observe are a strong constraint for future chemical models.
We identify the need for the following key studies to constrain further the chemistry of dimethyl ether and O-bearing complex species: search for mantle species produced by the CH2OH radical; search for CH3; maps of t-HCOOCH3 and HCOOH; theoretical/laboratory studies of protonated methanol reaction at high speed (shocked) on H2CO and CH3OH. The conditions leading to the convergence of the dimethyl ether/methyl formate ratio in a complex chemical network could also be investigated.
Shock related molecule release from grains and shock induced chemistry of complex molecules need to be modeled. The issue of the efficiency or lack of such chemical conditions to transform molecules in a short time lapse (<103 yr) is critical in the discussion of the merits of the two methyl formate and dimethyl ether production schemes (gas phase production vs. simple release); this will be addressed in a future work.
This research made use of the myXCLASS program (https://www.astro.uni-koeln.de/projects/schilke/XCLASS), which accesses the CDMS (http://www.cdms.de) and JPL (http://spec.jpl.nasa.gov) molecular data bases.
The mantle chemistry scheme needs UV radiation to produce radicals. Is it possible in Orion KL? According to our previous study on deuterated methanol (Peng et al. 2012), the composition of ice mantles might have been largely determined in an earlier phase of the cloud, well before the explosive event. During this earlier phase, the matter was conceivably more uniform and less dense, hence less opaque to UV. The present very high opacity of the cloud (up to Av > 1000, Favre et al. 2011a) suggests that processing by external UV sources is now negligible except on a very thin external layer. Inside a dense cloud UV can also be produced by dissociative shocks (e.g. Neufeld & Dalgarno 1989) or by secondary electrons (e.g. Gredel et al. 1989; Prasad & Tarafdar 1983). The presence of at least one B star inside Orion KL (the BN object) could also be an internal UV source but which is unlikely to reach the compact ridge due to absorption. However, as we have no knowledge of the precise 3D structure of the cloud, we cannot completely exclude that there are holes in the gas and we ignore the 3D dust distribution within Orion-KL. But the simplest origin for the UV mantle irradiation remains that it occurred at an earlier epoch. Note that radicals can be formed also in mantles also by irradiation by charged particles (see e.g. Bennett & Kaiser 2007; Herbst & van Dishoeck 2009).
Acknowledgments
This research has made use of the SIMBAD database, operated at the CDS, Strasbourg, France, and of the Splatalogue database (http://www.splatalogue.net, Remijan et al. 2007). This work was supported by the CNRS national programs PCMI (Physics and Chemistry of the Interstellar Medium) and GDR Exobiology. We thank J. Cernicharo for his IRAM 30 m spectra. We thank the referee and the editor for raising interesting issues.
References
- Allen, D. A., & Burton, M. G. 1993, Nature, 363, 54 [NASA ADS] [CrossRef] [Google Scholar]
- Belloche, A., Garrod, R. T., Müller, H. S. P., et al. 2009, A&A, 499, 215 [NASA ADS] [CrossRef] [EDP Sciences] [Google Scholar]
- Bennett, C. J., & Kaiser, R. I. 2007, ApJ, 661, 899 [NASA ADS] [CrossRef] [Google Scholar]
- Beuther, H., Zhang, Q., Greenhill, L. J., et al. 2005, ApJ, 632, 355 [NASA ADS] [CrossRef] [Google Scholar]
- Beuther, H., Zhang, Q., Reid, M. J., et al. 2006, ApJ, 636, 323 [NASA ADS] [CrossRef] [Google Scholar]
- Bisschop, S. E., Jørgensen, J. K., van Dishoeck, E. F., & de Wachter, E. B. M. 2007, A&A, 465, 913 [NASA ADS] [CrossRef] [EDP Sciences] [Google Scholar]
- Blake, G. A. 1988, in Molecular Clouds, Milky-Way and External Galaxies, eds. R. L. Dickman, R. L. Snell, & J. S. Young, Lect. Notes Phys. (Berlin: Springer Verlag), 315, 132 [Google Scholar]
- Blake, G. A., Sutton, E. C., Masson, C. R., & Phillips, T. G. 1987, ApJ, 315, 621 [NASA ADS] [CrossRef] [Google Scholar]
- Blake, G. A., Mundy, L. G., Carlstrom, J. E., et al. 1996, ApJ, 472, L49 [NASA ADS] [CrossRef] [Google Scholar]
- Caselli, P., Hasegawa, T. I., & Herbst, E. 1993, ApJ, 408, 548 [NASA ADS] [CrossRef] [Google Scholar]
- Cernicharo, J., Marcelino, N., Roueff, E., et al. 2012, ApJ, 759, L43 [NASA ADS] [CrossRef] [Google Scholar]
- Charnley, S. B., Kress, M. E., Tielens, A. G. G. M., & Millar, T. J. 1995, ApJ, 448, 232 [NASA ADS] [CrossRef] [Google Scholar]
- Clark, B. G. 1980, A&A, 89, 377 [NASA ADS] [Google Scholar]
- Clark, F. O., Lovas, F. J., & Johnson, D. R. 1979, ApJ, 229, 553 [NASA ADS] [CrossRef] [Google Scholar]
- Comito, C., Schilke, P., Phillips, T. G., et al. 2005, ApJS, 156, 127 [NASA ADS] [CrossRef] [Google Scholar]
- Eisner, J. A., Plambeck, R. L., Carpenter, J. M., et al. 2008, ApJ, 683, 304 [NASA ADS] [CrossRef] [Google Scholar]
- Endres, C. P., Drouin, B. J., Pearson, J. C., et al. 2009, A&A, 504, 635 [NASA ADS] [CrossRef] [EDP Sciences] [Google Scholar]
- Favre, C., Despois, D., Brouillet, N., et al. 2011a, A&A, 532, 32 [Google Scholar]
- Favre, C., Wootten, H. A., Remijan, A. J., et al. 2011b, ApJ, 739, L12 [NASA ADS] [CrossRef] [Google Scholar]
- Friedel, D. N., & Snyder, L. E. 2008, ApJ, 672, 962 [NASA ADS] [CrossRef] [Google Scholar]
- Garrod, R. T., Weaver, S. L. W., & Herbst, E. 2008, ApJ, 682, 283 [NASA ADS] [CrossRef] [Google Scholar]
- Goddi, C., Greenhill, L. J., Humphreys, E. M. L., et al. 2009, ApJ, 691, 1254 [NASA ADS] [CrossRef] [Google Scholar]
- Goddi, C., Humphreys, E. M. L., Greenhill, L. J., Chandler, C. J., & Matthews, L. D. 2011, ApJ, 728, 15 [NASA ADS] [CrossRef] [Google Scholar]
- Gómez, L., Rodríguez, L. F., Loinard, L., et al. 2005, ApJ, 635, 1166 [NASA ADS] [CrossRef] [Google Scholar]
- Gredel, R., Lepp, S., Dalgarno, A., & Herbst, E. 1989, ApJ, 347, 289 [NASA ADS] [CrossRef] [Google Scholar]
- Guélin, M., Brouillet, N., Cernicharo, J., Combes, F., & Wooten, A. 2008, Ap&SS, 313, 45 [NASA ADS] [CrossRef] [Google Scholar]
- Herbst, E., & van Dishoeck, E. F. 2009, ARA&A, 47, 427 [NASA ADS] [CrossRef] [Google Scholar]
- Hirota, T., Bushimata, T., Choi, Y. K., et al. 2007, PASJ, 59, 897 [NASA ADS] [CrossRef] [Google Scholar]
- Horn, A., Møllendal, H., Sekiguchi, O., et al. 2004, ApJ, 611, 605 [NASA ADS] [CrossRef] [Google Scholar]
- Johansson, L. E. B., Andersson, C., Ellder, J., et al. 1984, A&A, 130, 227 [NASA ADS] [PubMed] [Google Scholar]
- Johansson, L. E. B., Andersson, C., Elder, J., et al. 1985, A&AS, 60, 135 [NASA ADS] [Google Scholar]
- Jørgensen, J. K., Bourke, T. L., Nguyen Luong, Q., & Takakuwa, S. 2011, A&A, 534, A100 [NASA ADS] [CrossRef] [EDP Sciences] [Google Scholar]
- Kim, M. K., Hirota, T., Honma, M., et al. 2008, PASJ, 60, 991 [NASA ADS] [CrossRef] [Google Scholar]
- Laas, J. C., Garrod, R. T., Herbst, E., & Widicus Weaver, S. L. 2011, ApJ, 728, 71 [NASA ADS] [CrossRef] [Google Scholar]
- Lee, C. W., & Cho, S.-H. 2002, J. Korean Astron. Soc., 35, 187 [Google Scholar]
- Lovas, F. J., Johnson, D. R., & Snyder, L. E. 1979, ApJS, 41, 451 [NASA ADS] [CrossRef] [Google Scholar]
- Menten, K. M., Reid, M. J., Forbrich, J., & Brunthaler, A 2007, A&A, 474, 515 [NASA ADS] [CrossRef] [EDP Sciences] [Google Scholar]
- Minh, Y. C., Ohishi, M., Roh, D. G., Ishiguro, M., & Irvine, W. M. 1993, ApJ, 411, 773 [NASA ADS] [CrossRef] [Google Scholar]
- Müller, H. S. P., Thorwirth, S., Roth, D. A., & Winnewisser, G. 2001, A&A, 370, L49 [NASA ADS] [CrossRef] [EDP Sciences] [Google Scholar]
- Müller, H. S. P., Schlöder, F., Stutzki, J., & Winnewisser, G. 2005, J. Mol. Struct., 742, 215 [NASA ADS] [CrossRef] [Google Scholar]
- Neill, J. L., Steber, A. L., Muckle, M. T., et al. 2011, J. Phys. Chem. A, 115, 6472 [CrossRef] [Google Scholar]
- Neufeld, D. A., & Dalgarno, A. 1989, ApJ, 340, 869 [NASA ADS] [CrossRef] [Google Scholar]
- Nissen, H. D., Cunningham, N. J., Gustafsson, M., et al. 2012, A&A, 540, A119 [NASA ADS] [CrossRef] [EDP Sciences] [Google Scholar]
- Öberg, K. I., Garrod, R. T., van Dishoeck, E. F., & Linnartz, H. 2009, A&A, 504, 891 [NASA ADS] [CrossRef] [EDP Sciences] [Google Scholar]
- Öberg, K. I., Bottinelli, S., Jorgensen, J. K., & van Dishoeck, E. F. 2010, ApJ, 716, 825 [NASA ADS] [CrossRef] [Google Scholar]
- Peeters, Z., Rodgers, S. D., Charnley, S. B., et al. 2006, A&A, 445, 197 [NASA ADS] [CrossRef] [EDP Sciences] [Google Scholar]
- Peng, T. C., Despois, D., Brouillet, N., Parise, B., & Baudry, A. 2012, A&A, 543, A152 [NASA ADS] [CrossRef] [EDP Sciences] [Google Scholar]
- Persson, C. M., Olofsson, A. O. H., Koning, N., et al. 2007, A&A, 476, 807 [NASA ADS] [CrossRef] [EDP Sciences] [Google Scholar]
- Prasad, S. S., & Tarafdar, S. P. 1983, ApJ, 267, 603 [NASA ADS] [CrossRef] [Google Scholar]
- Remijan, A. J., Leigh, D. P., Markwick-Kemper, A. J., & Turner, B. E. 2008, e-prints [arXiv:0802.2273] [Google Scholar]
- Remijan, A. J., Markwick-Kemper, A., & ALMA Working Group on Spectral Line Frequencies. 2007, in BAAS, 39, Amer. Astron. Soc. Meet. Abstr., 132.11 [Google Scholar]
- Requena-Torres, M. A., Martín-Pintado, J., Rodríguez-Franco, A., et al. 2006, A&A, 455, 971 [NASA ADS] [CrossRef] [EDP Sciences] [Google Scholar]
- Requena-Torres, M. A., Martín-Pintado, J., Martín, S., & Morris, M. R. 2008, ApJ, 672, 352 [NASA ADS] [CrossRef] [Google Scholar]
- Rodríguez, L. F., Poveda, A., Lizano, S., & Allen, C. 2005, ApJ, 627, L65 [NASA ADS] [CrossRef] [Google Scholar]
- Sandstrom, K. M., Peek, J. E. G., Bower, G. C., Bolatto, A. D., & Plambeck, R. L. 2007, ApJ, 667, 1161 [NASA ADS] [CrossRef] [Google Scholar]
- Schilke, P., Groesbeck, T. D., Blake, G. A., & Phillips, T. G. 1997, ApJS, 108, 301 [NASA ADS] [CrossRef] [Google Scholar]
- Schilke, P., Benford, D. J., Hunter, T. R., Lis, D. C., & Phillips, T. G. 2001, ApJS, 132, 281 [NASA ADS] [CrossRef] [Google Scholar]
- Snyder, L. E., Buhl, D., Schwartz, P. R., et al. 1974, ApJ, 191, L79 [NASA ADS] [CrossRef] [Google Scholar]
- Sutton, E. C., Peng, R., Danchi, W. C., et al. 1995, ApJS, 97, 455 [NASA ADS] [CrossRef] [Google Scholar]
- Turner, B. E. 1989, ApJS, 70, 539 [NASA ADS] [CrossRef] [Google Scholar]
- Turner, B. E. 1991, ApJS, 76, 617 [NASA ADS] [CrossRef] [Google Scholar]
- Zapata, L. A., Schmid-Burgk, J., Ho, P. T. P., Rodríguez, L. F., & Menten, K. M. 2009, ApJ, 704, L45 [NASA ADS] [CrossRef] [Google Scholar]
- Ziurys, L. M., & McGonagle, D. 1993, ApJS, 89, 155 [NASA ADS] [CrossRef] [Google Scholar]
All Tables
Main parameters of the IRAM Plateau de Bure interferometer data sets where transitions of dimethyl ether are detected.
Detected and blended transitions of dimethyl ether observed with the Plateau de Bure Interferometer toward Orion-KL.
Positions of the main HCOOCH3 emission peaks observed with the Plateau de Bure Interferometer toward Orion-KL as identified in Favre et al. (2011a).
CH3OCH3 synthetic spectra parameters (velocity, line width, beam-averaged temperature and column density) which reproduce best the PdBI spectra at the emission peaks MF1 to MF5 for the angular resolutions of the 101 GHz (3.63″ × 2.26″) and 223 GHz (1.79″ × 0.79″) observations.
CH3OCH3 abundance relative to HCOOCH3 at the emission peaks MF1 to MF5 for the angular resolutions of the 101 GHz (3.63″ × 2.26″) and 223 GHz (1.79″ × 0.79″) observations.
All Figures
|
Fig. 1 Dimethyl ether integrated intensity maps obtained with the Plateau de Bure Interferometer: these panels show the sum of the emission of the transitions at 80.54 GHz, 101.56 GHz, 203.42 GHz and 223.41 GHz. The first contour and the step are 0.5 Jy/beam, 0.2 Jy/beam, 2 Jy/beam and 0.3 Jy/beam at 80.54 GHz, 101.56 GHz, 203.42 GHz and 223.41 GHz respectively. Note that the 203.42 GHz transitions are blended with the H |
| In the text | |
|
Fig. 2 Dimethyl ether integrated intensity maps obtained with the Plateau de Bure Interferometer (sum of emission at 223.409 GHz and 223.412 GHz between 5 and 12 km s-1). The bottom image is a blowup of the Hot Core/Compact Ridge map area. The beam is 1.79″ × 0.79″; the level step and first contour are 3.8 K km s-1. The position of the millimeter source MM23 (Eisner et al. 2008) is also indicated. The main different HCOOCH3 emission peaks identified in Favre et al. (2011a) are marked by a cross and labeled MFNUMBER. Note that the dimethyl ether distribution is very similar to that of methyl formate (cf. Fig. 4 in Favre et al. 2011a, and see Sect. 5.1.1). |
| In the text | |
|
Fig. 3 CH3OCH3 intensity maps integrated in velocity between 5 and 12 km s-1. The line frequency and the upper state energy are indicated on each plot. The CH3OCH3 43.47 GHz map was obtained with the EVLA (Favre et al. 2011b). The dimethyl ether emission is stronger towards the compact ridge than the hot core SW position for low upper energy transitions, while the opposite is the case for high upper state energies. |
| In the text | |
|
Fig. 4 Dimethyl ether spectrum at 101.56 GHz observed with the IRAM 30 m radiotelescope (in black, J. Cernicharo, priv. comm.) overlaid on the PdBI spectrum convolved to the same spatial resolution (in red). |
| In the text | |
|
Fig. 5 CH3OCH3 synthetic spectra (in red) overlaid on the observed spectra toward the MF1 to MF5 positions. The 101 GHz, 203 GHz and 223 GHz observations are in the left, middle and right columns respectively. The observed spectrum at 223 GHz is at the edge of the bandwidth. |
| In the text | |
|
Fig. 6 Comparison of the methyl formate map (left) at 223.534 GHz (Eu = 305 K) and the dimethyl ether map (right) at 223.41 GHz (Eu = 330 K). The transitions are from the same data cube and the 1.79″ × 0.79″ beam is plotted in the bottom left corner. |
| In the text | |
|
Fig. 7 Plot of the intensity of pixels in the methyl formate maps versus the intensity of the same pixels in the dimethyl ether (top left), ethanol (top right), formic acid (bottom left) and methyl formate (bottom right) maps. Care has been taken to use transitions with similar Eu energies. The methyl formate (Eu = 305 K) at 223.534 GHz is compared to the dimethyl ether transition (Eu = 330 K) at 223.41 GHz and to the ethanol transition (Eu = 346 K) at at 223.629 GHz. The methyl formate transition (Eu = 50 K) at 223.500 GHz is compared to the formic acid transition (Eu = 72 K) at 223.915 GHz and to the methyl formate transition (Eu = 50 K) at 223.465 GHz. Dimethyl ether shows clearly the highest spatial correlation with methyl formate. |
| In the text | |
|
Fig. 8 Methyl formate channel map (black contours) at 8 km s-1 (sum of the transitions at 223.465 and 223.500 GHz, Eu = 50 K) overlaid on the formic acid channel map (colors) at the same velocity for the 223.915 GHz transition (Eu = 72 K). All data are taken from the same data set (1.79″ × 0.79″ resolution). |
| In the text | |
Current usage metrics show cumulative count of Article Views (full-text article views including HTML views, PDF and ePub downloads, according to the available data) and Abstracts Views on Vision4Press platform.
Data correspond to usage on the plateform after 2015. The current usage metrics is available 48-96 hours after online publication and is updated daily on week days.
Initial download of the metrics may take a while.