Fig. 3
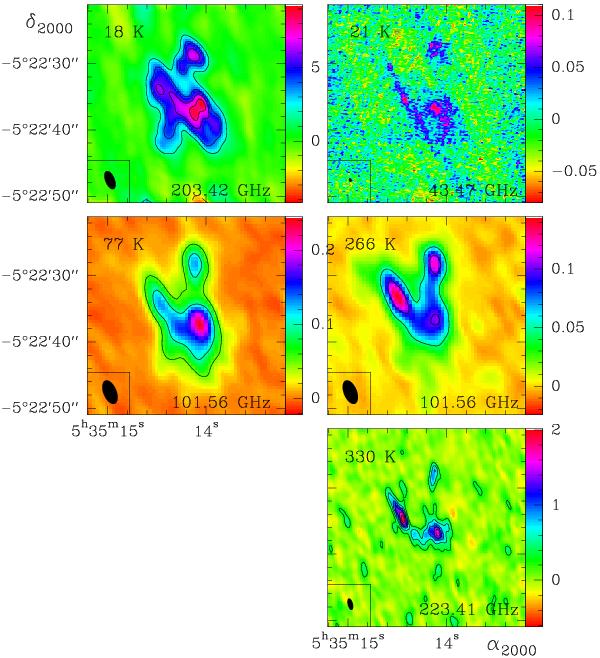
CH3OCH3 intensity maps integrated in velocity between 5 and 12 km s-1. The line frequency and the upper state energy are indicated on each plot. The CH3OCH3 43.47 GHz map was obtained with the EVLA (Favre et al. 2011b). The dimethyl ether emission is stronger towards the compact ridge than the hot core SW position for low upper energy transitions, while the opposite is the case for high upper state energies.
Current usage metrics show cumulative count of Article Views (full-text article views including HTML views, PDF and ePub downloads, according to the available data) and Abstracts Views on Vision4Press platform.
Data correspond to usage on the plateform after 2015. The current usage metrics is available 48-96 hours after online publication and is updated daily on week days.
Initial download of the metrics may take a while.