Free Access
Fig. 8
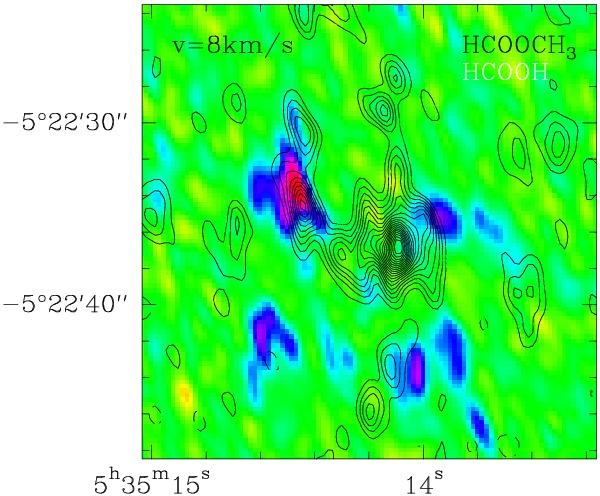
Methyl formate channel map (black contours) at 8 km s-1 (sum of the transitions at 223.465 and 223.500 GHz, Eu = 50 K) overlaid on the formic acid channel map (colors) at the same velocity for the 223.915 GHz transition (Eu = 72 K). All data are taken from the same data set (1.79″ × 0.79″ resolution).
Current usage metrics show cumulative count of Article Views (full-text article views including HTML views, PDF and ePub downloads, according to the available data) and Abstracts Views on Vision4Press platform.
Data correspond to usage on the plateform after 2015. The current usage metrics is available 48-96 hours after online publication and is updated daily on week days.
Initial download of the metrics may take a while.