Free Access
Fig. 5
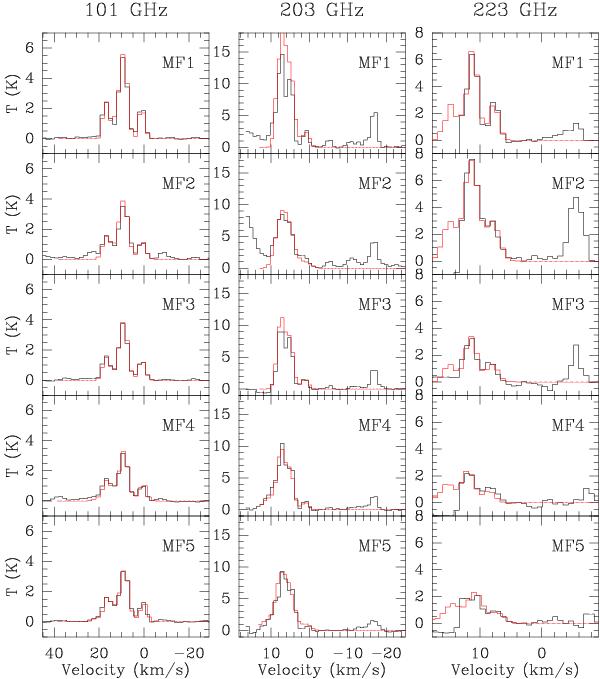
CH3OCH3 synthetic spectra (in red) overlaid on the observed spectra toward the MF1 to MF5 positions. The 101 GHz, 203 GHz and 223 GHz observations are in the left, middle and right columns respectively. The observed spectrum at 223 GHz is at the edge of the bandwidth.
Current usage metrics show cumulative count of Article Views (full-text article views including HTML views, PDF and ePub downloads, according to the available data) and Abstracts Views on Vision4Press platform.
Data correspond to usage on the plateform after 2015. The current usage metrics is available 48-96 hours after online publication and is updated daily on week days.
Initial download of the metrics may take a while.