Fig. 1
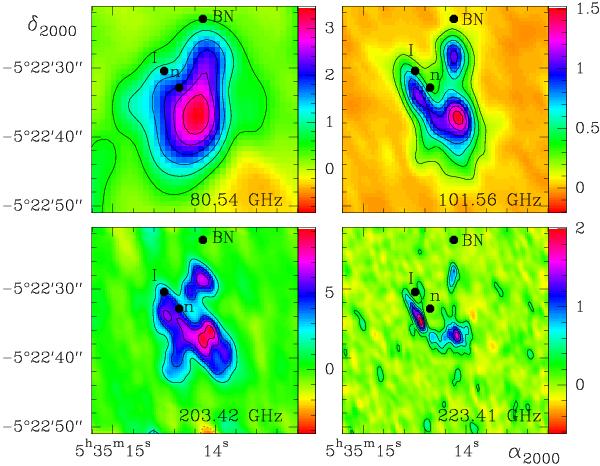
Dimethyl ether integrated intensity maps obtained with the Plateau de Bure Interferometer: these panels show the sum of the emission of the transitions at 80.54 GHz, 101.56 GHz, 203.42 GHz and 223.41 GHz. The first contour and the step are 0.5 Jy/beam, 0.2 Jy/beam, 2 Jy/beam and 0.3 Jy/beam at 80.54 GHz, 101.56 GHz, 203.42 GHz and 223.41 GHz respectively. Note that the 203.42 GHz transitions are blended with the H O line at 203.407 GHz around (αJ2000 = 05h35m14
 5, δJ2000 = −05°22′34″). The BN object position is (αJ2000 = 05h35m141094, δJ2000 = −05°22′22
 724), the radio source I position is (αJ2000 = 05h35m145141, δJ2000 = −05°22′30575), and the IR source n position is (αJ2000 = 05h35m143571, δJ2000 = −05°22′32719) from Goddi et al. (2011).
Current usage metrics show cumulative count of Article Views (full-text article views including HTML views, PDF and ePub downloads, according to the available data) and Abstracts Views on Vision4Press platform.
Data correspond to usage on the plateform after 2015. The current usage metrics is available 48-96 hours after online publication and is updated daily on week days.
Initial download of the metrics may take a while.