Fig. 2
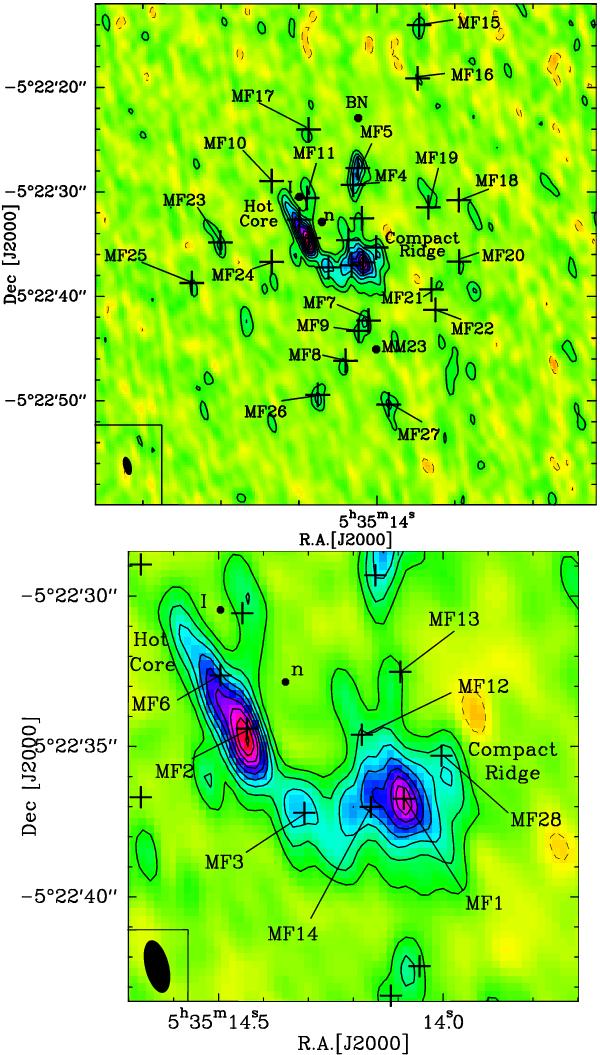
Dimethyl ether integrated intensity maps obtained with the Plateau de Bure Interferometer (sum of emission at 223.409 GHz and 223.412 GHz between 5 and 12 km s-1). The bottom image is a blowup of the Hot Core/Compact Ridge map area. The beam is 1.79″ × 0.79″; the level step and first contour are 3.8 K km s-1. The position of the millimeter source MM23 (Eisner et al. 2008) is also indicated. The main different HCOOCH3 emission peaks identified in Favre et al. (2011a) are marked by a cross and labeled MFNUMBER. Note that the dimethyl ether distribution is very similar to that of methyl formate (cf. Fig. 4 in Favre et al. 2011a, and see Sect. 5.1.1).
Current usage metrics show cumulative count of Article Views (full-text article views including HTML views, PDF and ePub downloads, according to the available data) and Abstracts Views on Vision4Press platform.
Data correspond to usage on the plateform after 2015. The current usage metrics is available 48-96 hours after online publication and is updated daily on week days.
Initial download of the metrics may take a while.