| Issue |
A&A
Volume 548, December 2012
|
|
|---|---|---|
| Article Number | A22 | |
| Number of page(s) | 15 | |
| Section | Extragalactic astronomy | |
| DOI | https://doi.org/10.1051/0004-6361/201220074 | |
| Published online | 13 November 2012 | |
Dust temperature and CO → H2 conversion factor variations in the SFR-M∗ plane⋆
1
Max-Planck-Institut für Extraterrestrische Physik (MPE),
Postfach 1312, 85741
Garching, Germany
e-mail: This email address is being protected from spambots. You need JavaScript enabled to view it.
; This email address is being protected from spambots. You need JavaScript enabled to view it.
2
Laboratoire AIM, CEA/DSM-CNRS-Université Paris Diderot,
IRFU/Service d’Astrophysique, Bât.
709, CEA-Saclay, 91191
Gif-sur-Yvette Cedex,
France
3
Department of Physics and Institute of Theoretical and
Computational Physics, University of Crete, 71002
Heraklion,
Greece
4
Chercheur Associé, Observatoire de Paris,
75014
Paris,
France
5
IESL/Foundation for Research and Technology-Hellas,
PO Box 1527, 71110
Heraklion,
Greece
6
Universität Wien, Institut für Astronomie,
Türkenschanzstraße 17,
1180
Wien,
Österreich
7
UK Astronomy Technology Centre, Royal Observatory,
Blackford Hill, Edinburgh
EH9 3HJ,
UK
8
Cavendish Laboratory, University of Cambridge,
19 J.J. Thomson Ave.,
Cambridge
CB3 0HE,
UK
9
Dipartimento di Astronomia, Universita di Padova,
Vicolo dell’Osservatorio 3,
35122
Padova,
Italy
10
INAF – Osservatorio Astronomico di Roma,
via di Frascati 33,
00040
Monte Porzio Catone,
Italy
11
School of Physics and Astronomy, The Raymond and Beverly Sackler
Faculty of Exact Sciences, Tel-Aviv University, Tel-Aviv
69978,
Israel
Received:
23
July
2012
Accepted:
1
October
2012
Abstract
Deep Herschel PACS/SPIRE imaging and 12CO(2−1) line luminosities from the IRAM Plateau de Bure Interferometer are combined for a sample of 17 galaxies at z > 1 from the GOODS-N field. The sample includes galaxies both on and above the main sequence (MS) traced by star-forming galaxies in the SFR-M∗ plane. The far-infrared data are used to derive dust masses, Mdust, following the Draine & Li (2007, ApJ, 657, 810) models. Combined with an empirical prescription for the dependence of the gas-to-dust ratio on metallicity (δGDR(μ0)), the CO luminosities and Mdust values are used to derive for each galaxy the CO-to-H2 conversion factor, αCO. Like in the local Universe, the value of αCO is a factor of ~5 smaller in starbursts compared to normal star-forming galaxies (SFGs). We additionally uncover a relation between αCO and dust temperature (Tdust; αCO decreasing with increasing Tdust) as obtained from modified blackbody fits to the far-infrared data. While the absolute normalization of the αCO(Tdust) relation is uncertain, the global trend is robust against possible systematic biases in the determination of Mdust, δGDR(μ0) or metallicity. Although we cannot formally distinguish between a step and a smooth evolution of αCO with the dust temperature, we can unambiguously conclude that in galaxies of near-solar metallicity, a critical value of Tdust = 30 K can be used to determine whether the appropriate αCO is closer to the “starburst” value (1.0 M⊙ (K km s-1 pc2)-1, when Tdust > 30 K) or closer to the Galactic value (4.35 M⊙ (K km s-1 pc2)-1, when Tdust < 30 K). This indicator has the great advantage of being less subjective than visual morphological classifications of mergers/SFGs, which can be difficult at high z because of the clumpy nature of SFGs. Using Tdust to select the appropriate αCO is also more indicative of ISM conditions than a fixed LIR criterion. In the absence of far-infrared data, the offset of a galaxy from the star formation main sequence (i.e., Δlog (SSFR)MS = log [SSFR(galaxy)/SSFRMS(M∗,z)]) can be used to identify galaxies requiring the use of an αCO conversion factor lower than the Galactic value (i.e., when Δlog (SSFR)MS ≳ 0.3 dex).
Key words: galaxies: evolution / infrared: galaxies / galaxies: starburst
Based on observations carried out with the IRAM Plateau de Bure Interferometer. IRAM is supported by INSU/CNRS (France), MPG (Germany) and IGN (Spain). Based also on observations carried out by the Herschel space observatory. Herschel is an ESA space observatory with science instruments provided by European-led Principal Investigator consortia and with important participation from NASA.
© ESO, 2012
1. Introduction
A correlation between the star formation rate (SFR) and the stellar mass (M∗) of star-forming galaxies has been observed over the last 10 Gyr of lookback time (SFR , with 0.5 < α < 1.0; Brinchmann et al. 2004; Schiminovich et al. 2007; Noeske et al. 2007; Elbaz et al. 2007; Daddi et al. 2007; Pannella et al. 2009; Rodighiero et al. 2010; Oliver et al. 2010; Magdis et al. 2010; Karim et al. 2011; Mancini et al. 2011). The existence of this main sequence (MS) of star formation is usually interpreted as evidence that the bulk of the galaxy population is forming stars gradually with long duty cycles. In this interpretation, galaxies situated on the MS are consistent with a secular mode of star formation, likely sustained by a continuous gas accretion from the IGM and along the cosmic web (Dekel et al. 2009; Davé et al. 2010), while star-forming galaxies located far above the MS are strong starbursts with short duty-cycles, mainly triggered by major mergers (see, e.g., Engel et al. 2010). In the last years, independent observational tests have given weight to this interpretation. For example, it is observed that galaxies situated on the MS of star-formation have a disk-like morphology, relatively low SFR surface density (Wuyts et al. 2011b), cold dust temperature (Magnelli et al. 2012; see also, Magnelli et al., in prep.) and large polycyclic aromatic hydrocarbons (PAHs) equivalent width (EW; Nordon et al. 2012; Elbaz et al. 2011). On the other hand, off-MS galaxies (i.e., situated above the MS) have cuspier morphology, higher SFR surface density, hotter dust temperature and smaller PAHs EW (Wuyts et al. 2011b; Magnelli et al. 2012; Nordon et al. 2012; Elbaz et al. 2011).
Off-MS galaxies reaching very high specific star formation rates (SSFR = SFR/M∗) do so by having enhanced star formation efficiencies (SFR/MH2; where MH2 is the molecular gas mass), as observed in local ULIRGs and high redshift submillimeter galaxies (e.g., Gao & Solomon 2004; Daddi et al. 2010; Genzel et al. 2010; Saintonge et al. 2011b). These results are however complicated by the fact that the CO-to-H2 conversion factor, αCO, also likely changes between normal star-forming discs on the main sequence and merger-driven starbursts (Solomon et al. 1997; Tacconi et al. 2008). Having either a measurement of αCO in any given galaxy, or a reliable prescription to assign its value is therefore critical to study variations in star formation efficiency across the galaxy population.
There are several methods to measure αCO in high-redshift galaxies. For example a careful analysis of the stellar and dynamical masses of luminous SMGs has been used to determine their CO-to-H2 conversion factor, αCO (Tacconi et al. 2008). Although successful, this method requires very high quality interferometric CO observations (i.e., spectroscopically and spatially resolved) in order to determine the dynamical masses of galaxies. Consequently, before the advent in the near future of the full capabilities of the Atacama Large Millimeter Array (ALMA), this method will be only available for a handful of CO-bright galaxies. In order to constrain αCO for a larger and fainter sample of galaxies another method is needed. In the local Universe, a method used to derive αCO relies on the determination of the gas mass of a galaxy via the measurement of its dust mass, using far-infrared observations, and an assumed gas-to-dust ratio (see, e.g., Leroy et al. 2011). Thanks to the advent of the Herschel Space Observatory, this method can now be applied to a large sample of high-redshift galaxies. Magdis et al. (2011, 2012) have pioneered this method on a sample including a dozen high-redshift galaxies. Based on this recent progress we apply this method to a larger sample of high-redshift galaxies.
Here we compile a large sample of 17 z > 1 galaxies in the GOODS-N field with both deep Herschel far-infrared measurements and accurate IRAM Plateau de Bure Interferometer (PdBI) line luminosities. After describing the sample selection, the data products, and the derived quantities in Sects. 2−4, we combine these measurements to measure the value of the conversion factor αCO for each galaxy, discuss its trends with different global galaxy properties, and address the impact of possible systematic biases (Sect. 5). Finally, the origin and impact of the observed relations between αCO and quantities such as Tdust and MS offset are discussed in Sect. 6 before the main conclusions are summarized in Sect. 7.
All rest-frame quantities derived in this work assume a Chabrier (2003) IMF, and a cosmology with H0 = 71 km s-1 Mpc-1, Ωm = 0.27 and ΩΛ = 0.73.
2. Sample selection
Our goal is to study the link between molecular gas, dust, star-formation activity and stellar mass in high-redshift galaxies. Such a study requires using direct tracers of molecular gas and dust, and probing a large dynamic range in the SFR-M∗ plane. One of the deep fields best suited for this study is GOODS-N, having a broad multi-wavelength coverage including some of the deepest Herschel maps (with both the PACS and SPIRE instrument, see Sect. 3.1), and with its northern location, being a privileged target for the IRAM Plateau de Bure Interferometer (PdBI). The interferometric observations produce the CO line fluxes from which total molecular gas masses can be extrapolated, while the dust content of high-redshift galaxies can be studied using the wide far-infrared wavelength coverage from Herschel.
We found 9 GOODS-N galaxies in the published literature with CO(1−0) or CO(2−1) measurements, HDF169 (GN26) in Frayer et al. (2008), BzK-4171, BzK-21000, BzK-16000, BzK-17999, BzK-12591 and BzK-25536 in Daddi et al. (2010), HDF242 (GN19) in Ivison et al. (2011), and finally GN20 in Carilli et al. (2010). Since BzK-25536 is not detected in the deep PACS and SPIRE images (see Sect. 3.1), it is excluded from our study. The remaining 8 galaxies1 are shown in the SFR-M∗ plane in the left panel of Fig. 1 (see Sect. 3.1 for a complete description of the data used to derive SFR and M∗). All of these galaxies lie above the mean star formation main sequence, with three SMGs being the strongest outliers. In order to study the evolution of the molecular gas content of galaxies as a function of their location in the SFR-M∗ plane, we have obtained new IRAM PdBI CO data for galaxies located on or even below this main sequence of star-formation.
At zs1, the Herschel observations of the GOODS-N field allow for the detection of galaxies with SFR ≳ 10 M⊙ yr-1, probing well into the main sequence for galaxies with M∗ > 1010.2 M⊙ (see, e.g., Rodighiero et al. 2010; Noeske et al. 2007; Elbaz et al. 2007; Karim et al. 2011). Here we use the definition of the main-sequence from Rodighiero et al. (2010), i.e., log (SSFR)MS = α log (M∗) + β where (α , β) = (−0.27,2.6), (−0.51,5.3) and (−0.49,5.2) at 0.5 < z < 1.0, 1.0 < z < 1.5 and z > 1.5, respectively. This choice is motivated by the use of the FIR as a star-formation indicator both in Rodighiero et al. (2010) and in this study as well as by the use of fully consistent stellar mass estimates2. However, none of our results strongly depend on this specific definition.
We selected 9 IRAM PdBI CO targets from the complete volume-limited sample of galaxies with 1.0 < z < 1.3, SFR ≳ 15 M⊙ yr-1 and M∗ > 1010.2 M⊙ (see Table 1). In addition, we required the galaxies to have reliable spectroscopic redshift measurements from Barger et al. (2008). We note that our sample is not intended to be complete, but rather to sample as uniformly as possible the SFR-M∗ plane (see Fig. 1). The combined sample of 17 galaxies, including the objects extracted from the literature and our new CO targets, spans almost two orders of magnitude in SFR at fixed stellar mass; the final distribution of main sequence offset (i.e., Δlog (SSFR)MS = log [SSFR(galaxy)/SSFRMS(M∗,z)] , where SSFR(galaxy) is the specific star-formation rate of our galaxies and SSFRMS(M∗,z) is the specific star-formation rate of MS galaxies at the redshifts and stellar masses of our galaxies) is shown in the right panel of Fig. 1.
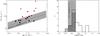 |
Fig. 1 (Left) The z ~ 1 star formation main sequence from Rodighiero et al. (2010) and the position of the GOODS-N sample with CO measurements and PACS/SPIRE photometry. Galaxies with new IRAM CO observations are shown as black circles while the red symbols are for galaxies with CO data from the literature (Frayer et al. 2008; Daddi et al. 2010; Carilli et al. 2010; Ivison et al. 2011). Among the red symbols, triangles stand for galaxies referred to SMGs. (Right) Distribution of distance from the star formation main sequence (Δlog (SSFR)MS), for the galaxies with the new IRAM CO observations (dashed histogram), and the combined sample including galaxies CO measurements from the literature (open histogram). Bins of 0.25 dex in Δlog (SSFR)MS are used. |
Measured and derived properties.
Mid- and far-infrared properties of our combined sample.
3. Data
3.1. Herschel and multi-wavelength observations
The new IRAM PdBI CO targets were selected from the Herschel observations of the GOODS-N field taken as part of the PACS Evolutionary Probe (PEP3; Lutz et al. 2011) guaranteed time key programme. However, to characterize their FIR/submm SEDs we use here the Herschel observations of the GOODS-N field taken as part of the GOODS-Herschel key programme (PI: D. Elbaz; Elbaz et al. 2011). This key programme provides deeper PACS observations of the GOODS-N field along with deep SPIRE observations, allowing us to make use of the full wavelength coverage (100−500 μm) offered by the Herschel Space Observatory. The GOODS-Herschel survey and data reduction methods are described in Elbaz et al. (2011). Here, we only summarise the properties relevant for our study.
PACS and SPIRE source extraction was done using a point-spread-function (PSF) fitting analysis (Magnelli et al. 2009), guided using the position of sources detected in the deep GOODS-N 24 μm observations from the Multiband Imaging Photometer (MIPS; Rieke et al. 2004) onboard the Spitzer Space Observatory (3σ s 20 μJy; Magnelli et al. 2011). This method both mitigates blending issues encountered in dense fields, and provides a straightforward association between MIPS, PACS and SPIRE sources as well as with the IRAC (Infrared Array Camera) sources from which the MIPS-24/70 μm catalogue was constructed (Magnelli et al. 2011). The GOODS-N PACS and SPIRE catalogues reach a 3σ limit of 1.1, 2.7, 7.5, 9.0 and 12.0 mJy at 100, 160, 250, 350 and 500 μm, respectively.
The GOODS-N field benefits from an extensive multiwavelength coverage. A PSF-matched catalogue was created for GOODS-N as part of the PEP survey4 (Berta et al. 2010, 2011), including photometry from far-UV to near-infrared and a collection of spectroscopic redshifts (mainly from Barger et al. 2008), complemented when needed with photometric redshifts computed using EAZY (Brammer et al. 2008). Stellar masses were derived by fitting Bruzual & Charlot (2003) templates to these far-UV to near-infrared photometries (see Sect. 4.3 for more detail). We cross-matched our IRAC-MIPS-PACS-SPIRE catalogue to this multi-wavelength catalogue, using the IRAC positions of each catalogue and a matching radius of 1′′.
Galaxies with CO observations from the literature were also cross-matched with the UV-to-far-infrared multi-wavelength catalogue. We verified that the available photometry and spectroscopic redshift from the literature were consistent with those from our multi-wavelength catalogue. We find no systematic discrepancies. Finally, we cross-matched using a 9′′ matching radius our sample with the 1.16 mm catalogue of Penner et al. (2011), which was built by combining the 1.1 mm AzTEC (Perera et al. 2008) and the 1.2 mm MAMBO (Greve et al. 2008) maps. We found a clear 1.16 mm detection for GN20 and obtained meaningful 1.16 mm upper limits (i.e., 3σ flux limits at the location of our galaxies) for the rest of our sample. Table 2 gives the infrared photometry for all the galaxies in the combined sample.
3.2. IRAM PdBI observations
Observations of the 9 Herschel-selected normal star-forming galaxies were performed at the IRAM PdBI (Guilloteau et al. 1992) in 2010 July−October under average summer conditions. We observed the CO(2−1) line (rest frequency of 230.538 GHz), which is redshifted into the 3 mm observing band for sources at z ~ 1. At the time of observing, the PdBI array was in compact configuration with 5 antennae available. The WideX correlator was used, providing dual polarization data with spectral resolution of 1.95 MHz over a total bandwidth of 3.6 GHz.
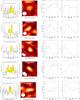 |
Fig. 2 CO(2−1) spectrum (left), integrated line map (center left panel), line flux versus WCO (center right panel) and signal over noise (S/N) versus WCO (right) of our 7 PdBI targets with secure (PEPJ123712+621753, PEPJ123759+621732, PEPJ123646+621141 and PEPJ123750+621600) and tentative line detection (PEPJ123709+621507, PEPJ123721+621346 and PEPJ123633+621005). In each spectrum, the yellow area displays the part of the spectrum over which the line fluxes are integrated. Dashed lines in the right two panels outline this value of WCO. To create the center right and right panels, we fixed the central frequency when increasing WCO to the central frequency of the yellow area displayed in the left panel. Dotted-dashed lines and triple-dotted-dashed lines represent the line flux and error of each object, respectively. Beam sizes are displayed in the lower left corner of each integrated line map. |
The data were calibrated with CLIC within the standard IRAM software package, GILDAS5. A standard passband calibration scheme was applied, followed by phase and amplitude calibration. The flux calibration was done using observation of reference bright quasars. Due to the poor observing conditions during some of the runs (e.g., high precipitable water vapour, strong winds, low elevation), particular care was taken to flag data with high phase noise. Finally, data cubes were created using the MAPPING environment and cleaned using the CLARK version of CLEAN implemented in GILDAS. The typical rms in the data cubes is of 0.8 mJy/beam with a typical beam diameter of s5′′. The data cubes were examined for sources at the expected spatial and spectral positions. The integrated line map and spectrum of each target are shown in Figs. 2 and 3. Four of the sources are securely detected, three are tentative detections, and the remaining two are non-detections. For the detections, line fluxes were measured by integrating the spectra over the width of the signal (WCO). Due to the absence of continuum in our spectra, WCO is defined as the frequency range maximizing the signal to noise ratio (S/N) (i.e., the peak of the S/N versus WCO plot). This WCO also corresponds to the frequency range where the curve of growth of the line flux reaches its plateau (see center right and right panels of Figs. 2 and 3). To create the S/N versus WCO and line flux versus WCO diagrams, we have to fix the central frequency around which we increase WCO. These fixed frequencies are defined as being the central frequencies of the yellow areas displayed in the left panels of Figs. 2 and 3. Uncertainties on WCO are defined as being the range of WCO over which S/N is greater than max[S/N(WCO)] −1. For non-detections we measured 3σ upper limits assuming WCO = 300 km s-1, typical for high-redshift galaxies (Tacconi et al. 2010). A summary of the observed CO fluxes and WCO for both literature and new sources is presented in Table 1.
4. Analysis
4.1. The CO(1−0) luminosities
Since the standard techniques to extrapolate MH2 from CO measurements are calibrated for observations of the J = 1 → 0 transition, the fluxes coming from observations done in higher transitions need to be converted into fluxes of the J = 1 → 0 transition. All but one of the galaxies have observations of the J = 2 → 1 transition, with HDF242 (aka GN19) observed directly in J = 1 → 0 transition (Ivison et al. 2011). Thanks to this homogeneity, our combined sample is mostly free of uncertainties in the excitation corrections when combining multi-transition samples. We adopt a ratio of S(2−1)/S(1−0) = 3, which is typically observed within the disks of local normal star-forming galaxies (e.g., Leroy et al. 2009) as well as in normal high-redshift star-forming galaxies (i.e., BzK galaxies; see e.g., Aravena et al. 2010)6. Recently Bothwell et al. (2012) found S(2−1)/S(1−0) = 3.36 ± 0.52 for a sample of 40 luminous SMGs, i.e., galaxies mostly situated far above the MS of star-formation. Because there is a clear agreement between the S(2−1)/S(1−0) flux ratio found in normal SFGs and SMGs, we conclude that the conversion of CO J = 2 → 1 fluxes into CO J = 1 → 0 fluxes does not introduce any differential biases in the CO(1−0) luminosity estimates of on- and off-MS galaxies. The CO(1−0) luminosities can then be calculated following Solomon et al. (1997):  (1)where S(1−0)ΔV is the integrated line flux in Jy km s-1, ν(1−0) ≡ 115.271 GHz is the rest-frame frequency of the CO(1−0) line, and DL is the luminosity distance in Mpc. Table 1 summarises the inferred CO properties of our sample.
4.2. Dust masses, dust temperatures and SFRs
To infer the dust mass of our galaxies we use the dust model of Draine & Li (2007, hereafter DL07). This model describes the interstellar dust as a mixture of carbonaceous and amorphous silicate grains with a size distribution mimicking the Milky Way (MW) extinction curve. The smallest carbonaceous grains have the properties of PAHs and their abundance is parametrized by the PAH index, qPAH, i.e., the fraction of dust mass in the form of PAH grains with less than 103 carbon atoms. The DL07 model assumes that a large fraction of the dust (i.e., 1 − γ with 0.0 < γ < 0.3) is situated in the diffuse ISM and exposed to a radiation field with a constant intensity Umin (U being a dimensionless scale factor normalized to the local interstellar radiation field of the MW). The remaining fraction of the dust (i.e., γ) is exposed to a power-law (α) radiation field ranging from Umin to Umax and corresponds to the dust enclosed in photodissociation regions (PDRs). Combining these two components, the dust emission spectrum of a galaxy is given by:  (2)where
  is the emitted spectrum per unit dust mass for the component heated by a single radiation field Umin, and pν(qPAH,Umin,Umax,α) is the emission spectrum for the PDR dust. DL07 found that the exact value of α does not have a large influence on the quality of their fits and fix α = 2. In addition, they suggest to fix Umax = 106 and to use 0.7 ≲ Umin ≲ 25 when submillimeter data are not available. This lower cutoff for Umin is made to avoid erroneously fitting very cold dust components to a set of data with no submm constraints. DL07 conclude that this cutoff does not introduce any systematic biases in their dust mass estimates.
Following these prescriptions, we build a grid of models with different PAH abundances (0.47% < qPAH < 4.6%), values of Umin (0.7−25) and values of γ (0.0−0.3). At each grid point, we compare the model SED and the FIR/submm photometry, with the dust mass given by the normalization of the SED that minimizes χ2. Integrating this best-fitting SED template from rest-frame 8 to 1000 μm, we also infer for the grid point the infrared luminosity (LIR) and SFR (with SFR[M⊙ yr-1] = 10-10 LIR[L⊙], assuming a Chabrier IMF). We assign for each galaxy a value of Mdust, LIR and SFR given by the geometric mean of the respective quantity across the region of the parameter space where  . These quantities, along with their 1σ uncertainties derived over the same grid points, are given in Table 3.
We find that our grid of DL07 models provides a good fit to the photometric data points, with a median χ2 = 1.8 for Ndof = 1. This is in agreement with DL07, Muñoz-Mateos et al. (2009) and Dale et al. (2012), who found that this particular set of models could reproduce well the large wealth of data available for the SINGS and KINGFISH galaxies. We note that some of our galaxies are also included in Magdis et al. (2012; i.e., the BzK galaxies). Our dust mass estimates for these galaxies are in agreement with those of Magdis et al. (2012) who also used the DL07 model.
Among our 17 galaxies, 12 have clear (S/N > 3, 8 galaxies) or tentative detections (3 > S/N > 2, 4 galaxies) of Herschel fluxes up to the rest-frame 160 μm wavelength. For these galaxies our dust mass estimates should be robust. Indeed, Dale et al. (2012) found that the lack of λrest > 160 μm observations does not introduce any systematic biases, although the scatter in the resulting dust masses may increase by up to s50%. The main conclusions of this paper are based on the comparison of our dust and gas measurements with empirical relations presented in Leroy et al. (2011), where results are also based on FIR measurements short-ward of rest-frame 160 μm. This consistency with the methodology of Leroy et al. (2011) trumps possible worries regarding the overall normalization of our dust masses in the absence of submm data.
For the remaining 5 galaxies, reliable Herschel fluxes are only available up to rest-frame 100 μm. To test for a systematic bias in the dust mass estimates of these galaxies, we re-fitted the other 12 galaxies this time omitting any flux measurements at λrest > 100 μm. We find no systematic biases, although the scatter in the resulting dust masses increases by s50% compared to the reference values obtained using the flux measurements at λrest > 100 μm.
Dust properties of our combined sample.
In order to obtain a proxy of the luminosity-weighted dust temperature of each galaxy, we fit their far-infrared SEDs, in the optically thin approximation, with a single modified blackbody function: 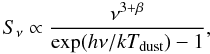 (3)where Sν is the flux density, β is the dust emissivity spectral index and Tdust is the dust temperature. We fix the dust emissivity spectral index to 1.5, a standard value shown to provide a good fit to the far-infrared SEDs of high-redshift galaxies (see, e.g., Magnelli et al. 2012). Since a single temperature model cannot fully describe the Wien side of the far-infrared SED of galaxies, because short wavelength observations are dominated by a warmer or transiently heated dust component, we exclude from our fitting procedure flux measurements with λrest < 50 μm.
The absolute dust temperature derived using a single blackbody model strongly depends on the assumed dust emissivity. For example, using β = 1.5 leads to dust temperatures systematically higher than if using β = 2.0 (ΔTdusts4 K). Nonetheless, fixing β to 1.5 or allowing it to vary freely between 1.5−2.0 does not significantly affect the main results presented in Sect. 5. In any case, to prevent our results from only relying on the dust temperature, we also use the far-infrared color of galaxies (i.e., fν [60 μm] /fν [100 μm] ; hereafter f60/f100) as an independent measure of the conditions prevailing in their ISMs (see, e.g., Dale et al. 2001). Here, f60/f100 is simply obtained using a log-linear interpolation between all our observed far-infrared data points. Because our observations always encompass the rest-frame 60 and 100 μm passbands, these estimates are robust and model independent.
From the normalization of the modified blackbody function we can also compute a dust mass: 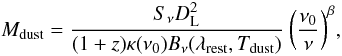 (4)where κ(ν0) is the dust mass absorption cross section at the reference frequency ν0. To allow direct comparison with the dust masses estimated using the DL07 model, we use the same dust mass absorption cross section at ν0 = c/100 μm, i.e., κ(ν0) = 3.13 m2 kg-1 (Li & Draine 2001). Dust temperatures and dust masses inferred from this single modified blackbody function are given in Table 3. Here again we quote the geometric mean across the region of parameter space satisfying
  and from which we define the 1σ uncertainties.
Figure 4 compares the dust masses obtained using a single modified blackbody function to those inferred using the DL07 model. Estimates based on a single modified blackbody function are systematically lower by a factor s3. This finding is in perfect agreement with that of Dale et al. (2012) based on local galaxies observed as part of the SINGS and KINGFISH surveys (see also Magdis et al. 2012). These discrepancies arise from the fact that single temperature models do not take into account warmer dust emitting at shorter wavelength. The behavior is also consistent with the analytic radiative transfer work of Chakrabarti & McKee (2008), who found that in high-redshift star-forming galaxies, dust masses inferred from isothermal models (equivalently single temperature blackbody approximation) are lower by a factor of s2 than those inferred using multi-T components (see Eq. (A8) of Chakrabarti & McKee 2008). In the rest of the paper we work with dust masses inferred using the DL07 model as they account for the warmer dust emitting at shorter wavelength. This choice is also motivated by the need to reduce any possible correlations between our dust temperature and dust mass estimates (see Sect. 5.2 for more details).
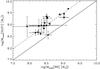 |
Fig. 4 Comparison of the dust masses estimated using the DL07 model with those estimated using a single temperature modified blackbody function. The solid line corresponds to the one-to-one relation while the dashed line is offset by a factor 3. We quote the geometric mean of Mdust across the region of parameter space where |
4.3. Stellar masses and metallicities
In order to estimate the stellar masses of our galaxies we use the multi-wavelength catalogue built by the PEP consortium and presented in Berta et al. (2010, 2011). It is a z + K-selected catalogue containing photometry in 16 bands from the Galex far-UV to Spitzer near-IR wavelengths. Stellar masses were calculated by fitting these multi-wavelength photometry to Bruzual & Charlot (2003) templates using FAST (Fitting and Assessment of Synthetic Templates; Kriek et al. 2009) and prescriptions presented by Wuyts et al. (2011b). We limit the Bruzual & Charlot (2003) templates to models with exponentially declining SFHs and a minimum e-folding time of 300 Myr. This allows for a much better agreement between SFRs derived from optical-to-near-IR SED fits and those derived using mid/far-infrared observations. Full details are presented in Wuyts et al. (2011a) and Wuyts et al. (2011b).
Metallicities are derived using the stellar-mass-metallicity relation at the redshift of the source (Genzel et al. 2012; see also Erb et al. 2006; Buschkamp et al., in prep.; Shapley et al. 2005; Liu et al. 2008):  (5)where a = −4.45 if 1.0 < z < 1.5 and a = −4.51 if z > 1.5. All metallicities are converted into the Denicoló et al. (2002) calibration system using the conversion function of Kewley & Ellison (2008). The Denicoló et al. calibration system provides the best agreement, at high stellar masses, between all different metallicity calibrators (Kewley & Ellison 2008). Table 3 presents our inferred metallicities. We note that metallicities estimated using the “fundamental metallicity relation” of Mannucci et al. (2010) extended to zs2 in Genzel et al. (2012) are consistent with those derived using Eq. (5).
5. The CO → H2 conversion factor
The total molecular gas mass is commonly derived from the measured CO line luminosity using a conversion factor αCO: 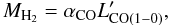 (6)where
  is in (K km s-1 pc2). The exact value of αCO and its possible dependency on a range of parameters were and are currently being actively investigated, both with observations and simulations (e.g., Solomon et al. 1987; Dickman et al. 1986; Maloney & Black 1988; Israel 2000; Bolatto et al. 2008; Leroy et al. 2011; Magdis et al. 2011; Genzel et al. 2012; Glover & Mac Low 2011; Narayanan et al. 2011; Shetty et al. 2011a,b; Schruba et al. 2012).
There is a general consensus that within the MW αCO = 4.34 M⊙ (K km s-1 pc2)-1, with little spatial variations (e.g., Strong & Mattox 1996; Dame et al. 2001; Abdo et al. 2010)7. There is also ample evidence for at least two sets of circumstances where αCO departs significantly from the Galactic value: low metallicity environments and the very dense central regions of merging systems. In low metallicity conditions, the CO molecules are lacking the dust shielding they require to survive the ambient radiation field everywhere but in the cores of GMCs, while the H2 molecules can survive in self-shielded envelopes around these cores (e.g., Wolfire et al. 2010). The result of this preferential photodissociation of the CO molecule are values of αCO larger by a factor of at least 5−10 (or even more) in local low-metallicity galaxies such as the SMC (Israel 1997; Johansson et al. 1998; Leroy et al. 2011; Bolatto et al. 2011; Schruba et al. 2012). On the other hand, in systems undergoing strong starbursts triggered by major mergers, such as nearby ULIRGs and high-z SMGs, the value of αCO is reduced by a factor of 5 (Solomon et al. 1997; Downes & Solomon 1998; Tacconi et al. 2008; but see Papadopoulos et al. 2012).
While these boundary conditions are generally accepted and routinely applied, the transitions between these different regimes are still being explored. Here we combine the IRAM molecular gas data and the Herschel dust masses to estimate a conversion factor for each galaxy in our combined sample, and compare the values with different prescriptions for αCO variations.
5.1. The gas-to-dust ratio method
Assuming that we can predict the gas-to-dust mass ratio δGDR in a galaxy, and having accurate molecular gas and dust masses, the conversion factor αCO can be estimated as: 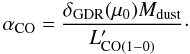 (7)To estimate δGDR for each galaxy, we use the relation of Leroy et al. (2011) which relates it to metallicity, i.e., μ0:
  (8)Recently, Magdis et al. (2011) have shown that this “dust-to-gas ratio method” constrains αCO in two well-studied GOODS-N galaxies to values consistent with standard expectations. However, we wish to point out three important assumptions required to extend this method from the local Universe to our high redshift galaxies:
-
1.
Since the CO observations were done in large part with thePdBI in compact configuration, and since the Herschel PSFeven at the shortest wavelengths has FWHM ~ 6′′ (i.e., cor-responding to linear scales of s48 kpc at zs1), we can only workwith integrated dust and gas measurements. Therefore,we must rely on the assumption that the total CO(2−1) linefluxes and the FIR fluxes we measure are emitted from thesame physical regions. In the local Universe, IR emissionand CO measurements are seen to correlate well, with atight relation between LFIR and LCO (e.g., Sanders& Mirabel 1985; Sanderset al. 1991; Gao& Solomon 2004), which can be inter-preted as evidence for them being produced in the same re-gion. Furthermore, in local normal star-forming galaxies,the radial profiles of CO(2−1) line emission and of IR flux,as traced by 24 μm emission, are strikingly similar (Leroyet al. 2008).
-
2.
Equation (7) is built under the assumption that MH2 ≫ MHI, and therefore that Mgas ≃ MH2 = δGDR(μ0) Mdust. While in nearby galaxies, on average MHI ~ 3 MH2, albeit with large galaxy-to-galaxy variations (Saintonge et al. 2011a), there are multiple reasons to suspect that the balance between atomic and molecular gas is significantly different in high redshift galaxies (see e.g., Obreschkow & Rawlings 2009). First, the molecular gas mass fraction fH2 = MH2/(M∗ + MH2), observed locally to be on average 6% in star-forming galaxies (Saintonge et al. 2011a), is found to be 30−50% at z = 1−2 (e.g., Tacconi et al. 2010; Daddi et al. 2010; Geach et al. 2011). It is therefore difficult to accommodate a significant atomic gas component within the total mass budget of these high-z galaxies as inferred from dynamical analysis. Observations of damped Lyman-α systems also suggest that the evolution of ΩHI between z = 0 and z = 2 is not as strong (see e.g., Fig. 2 of Obreschkow & Rawlings 2009). Finally, both models and observations indicate that above a critical surface density of ~10 M⊙ pc-2 most of the gas is found in molecular form, with HI saturating at that threshold (e.g., Wong & Blitz 2002; Schaye 2004; Blitz & Rosolowsky 2006; Bigiel et al. 2008). Since high-z star-forming galaxies have high surface densities, we can therefore expect minimal contributions from HI over the regions of the disks where the CO and FIR emission are originating.
-
3.
We also work under the assumption that the local relation between δGDR and metallicity applies in the denser ISM of high-redshift galaxies. In denser environments, the depletion of heavy elements from the gas phase is expected to increase (Jenkins 2009), leading to lower δGDR(μ0) values. However, in the denser environment of local-ULIRGs, only a mild decrease of δGDR(μ0) is observed, compared to normal star-forming galaxies (Solomon et al. 1997; Wilson et al. 2008; Santini et al. 2010; Clements et al. 2010). Thus, even if high-redshift galaxies exhibit high surface densities, the effect on δGDR(μ0) should not exceed a factor 2. The consequence of this effect is further discussed in Sect. 5.2. Due to their higher surface densities, high redshift galaxies might also have higher dust emissivity (see, e.g., Arce & Goodman 1999; Dutra et al. 2003; Cambrésy et al. 2005; Michałowski et al. 2010) than local galaxies. This would affect our dust mass estimates. However, we show in Sect. 5.2 than this effect does not strongly affect our main results.
Based on these assumptions, we can combine the IRAM molecular gas data and the Herschel dust masses to estimate αCO in each of the GOODS-N galaxies.
5.2. Results
Figure 5 shows the value of αCO as a function of metallicity (μ0), dust temperature (Tdust), far-infrared color (f60/f100) and distance of a galaxy with respect to the MS of star-formation (Δlog (SSFR)MS). Our galaxies roughly follow the αCO-μ0 relation found in Genzel et al. (2012), although with a larger scatter (s0.5 dex as opposed to the expected s 0.2 dex) and over a limited metallicity range which makes the slope uncertain. We note that this larger scatter is expected because our sample contains normal SFGs and merger-driven starbursts as opposed to Genzel et al. (2012) who studied normal SFGs. This scatter however correlates with Tdust, f60/f100 and Δlog (SSFR)MS. We note that Graciá-Carpio et al. (2011) also proposed, in the local Universe, for a smooth evolution of αCO with f60/f100. Their empirical relation is shown in the αCO-f60/f100 panel of Fig. 5. Despite some possible discrepancies in the absolute normalization of our two correlations, we find that the relative variation of αCO with f60/f100 found in our two studies are in excellent agreement. Our αCO-Δlog (SSFR)MS relation is also consistent with the results of Magdis et al. (2012) who find that galaxies situated off the MS exhibit lower αCO than galaxies on the MS of star-formation.
In order to characterize the correlation of αCO with the different quantities, we fit these relations with (i) a constant, (ii) a step and (iii) a linear function. To take into account errors both in X and Y, we use a Monte-Carlo approach. We create 1000 mock samples with the same number of sources as our original sample. For each realization and for each galaxy, we attribute new values of αCO, Tdust, f60/f100 and Δlog (SSFR)MS selected into a Gaussian distribution centered at their original values and with a dispersion given by their errors. We then fit each Monte-Carlo realization with our three different models (i.e., constant, step and linear functions). Table 4 summarizes the results. For each model, we quote the mean value and dispersion of each fitting parameter across the 1000 Monte-Carlo realizations. To assess the degree of correlation between αCO and Tdust, f60/f100 and Δlog (SSFR)MS, we also perform Spearman’s test on each of the Monte-Carlo realizations, the results of which are also given in Table 4. The test reveals that the correlation of αCO with either Tdust or f60/f100 is stronger than with Δlog (SSFR)MS.
For the three relations shown in Figs. 5b−d, the constant-αCO model always leads to higher reduced χ2 values than the step and linear functions, and can thus be rejected. For the αCO-f60/f100 correlation, the step and linear models are statistically undistinguishable, while in the case of the αCO-Tdust and αCO-Δlog (SSFR)MS correlations, the step function is statistically slightly better than the linear model. However, there is a large overlap in the reduced χ2 distributions of the two models, preventing us to adopt or reject either. We note that in the case of the step function, the values of αCO below and above the break differ by a factor of 5, consistent with the relative difference between the Galactic and starburst αCO values measured in the local Universe (see, e.g., Solomon et al. 1997). Although we cannot distinguish between a step and a linear model, we can unambiguously conclude that αCO strongly correlates with Tdust and f60/f100 and in a weaker way with Δlog (SSFR)MS. Before discussing the meaning of these correlations (Sect. 6), we first discuss their robustness against systematic biases in the quantities involved in Eq. (7), i.e., δGDR(μ0), Mdust and μ0.
Parameter values of the αCO − Tdust, αCO − f60/f100 and αCO-Δlog (SSFR)MS correlations
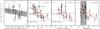 |
Fig. 5 αCO(1−0) as function of metallicity (i.e., μ0), dust temperature derived from fitting a single modified blackbody function (i.e., Tdust, see Sect. 4.2), rest-frame far-infrared color (i.e., f60/f100) and distance with respect to the main sequence of star-formation (i.e., Δlog (SSFR)MS). Filled and opened circles represent our 4 secure and 3 tentative IRAM CO detections, respectively. Our 2 IRAM CO upper limits are shown by arrows. BzK galaxies and SMGs are shown by filled squares and triangles, respectively. The shaded area in panel a) represents the αCO(1−0) − μ0 relation and its 1σ uncertainty as found in Genzel et al. (2012). The shaded area in panel d) represents the 1σ scatter around the MS of Rodighiero et al. (2010). The grey line in panel c) represents the empirical αCO(1−0) − f60/f100 relation observed in the local Universe by Graciá-Carpio et al. (2011). Red lines in panel b), c) and d) present fits to the data points using a constant (dashed-triple-dotted line), a step (dashed-dotted line) and a linear (solid) function. Red lines are intentionally limited to the parameter space in which we have direct constraints. |
(i) Uncertainties on the δGDR(μ0) relation: We have assumed that the z ~ 1 GOODS-N star-forming discs follow the local δGDR(μ0) relation derived by Leroy et al. (2011). Instead, this relation might evolve with redshift, both in terms of normalization and slope. Because αCO linearly scales with δGDR(μ0) (see Eq. (7)), a different δGDR(μ0) relation at high-redshift would scale upward or downward the inferred values of αCO. Since all but two of our galaxies are situated in a narrow range of redshifts (i.e., 1.0 < z < 1.6) and a narrow range of metallicities, a change in the normalization of the δGDR(μ0) relation with redshift would only translate into a re-normalization of our correlations, leaving their slopes mostly unchanged. Furthermore, since galaxies with cold and hot dust temperatures span similar metallicity ranges (Fig. 5; it would also be the case using metallicities inferred with the “fundamental metallicity relation” of Mannucci et al. 2010, see point (iii)), a change of the slope of the δGDR(μ0) should not affect significantly our correlations. For example, the correlation of αCO with Tdust, f60/f100 and Δlog (SSFR)MS is recovered if using a constant value for the gas-to-dust ratio (150) rather than the metallicity dependent δGDR(μ0). To produce the relations of Fig. 5, δGDR(μ0) would have to vary differentially for galaxies with cold and hot dust temperatures. High dust temperatures are usually associated with the dense star-forming regions of major merger-driven starbursts (Sanders et al. 2003; Chapman et al. 2003; Magnelli et al. 2012; Hayward et al. 2012). In these denser environments, the depletion of heavy elements from the gas phase is expected to increase (Jenkins 2009), leading to lower δGDR(μ0) values. Values of δGDR(μ0) in the dense environment of local ULIRGs are indeed found to be smaller than in normal star-forming galaxies (Solomon et al. 1997; Wilson et al. 2008; Santini et al. 2010; Clements et al. 2010), by a factor of at most s 2. Taking into account this variation of δGDR(μ0) with density would however strengthen the correlation of αCO on e.g., Tdust. Indeed, Eq. (7) clearly shows that a lower value of δGDR(μ0) for galaxies with high densities and hot dust would result in an even smaller αCO compared to the normal star-forming galaxies with colder dust temperatures. We therefore conclude that it is unlikely that the uncertainties on the high-redshift δGDR(μ0) relation can artificially produce the observed correlation of αCO with Tdust, f60/f100 and Δlog (SSFR)MS.
(ii) Uncertainties on our dust mass estimates:
We have followed the approach of Leroy et al. (2011) in following DL07 to infer dust masses. Consequently, any biases introduced by the DL07 method would affect both our dust mass estimates and their δGDR(μ0) prescription. This consistency (also in term of rest-frame wavelength coverage, see Sect. 4.2) protects αCO from systematic biases introduced by the methodology selected to calculate the dust masses. To erase our correlations, any dust mass bias would have to be specific to our galaxy sample, and correlate with their dust temperatures. Compared to the objects studied in Leroy et al. (2011), one specificity of our sample is that it also includes galaxies which are analogues of local-ULIRG, i.e., merger-driven starbursts like SMGs (see, e.g., Tacconi et al. 2008; Magnelli et al. 2012). Because these merger-driven starbursts have denser environments, they might have higher dust emissivity than normal star-forming galaxies (see, e.g., Arce & Goodman 1999; Dutra et al. 2003; Cambrésy et al. 2005; Michałowski et al. 2010). Therefore, using the DL07 method, we may have overestimated the dust masses of our merger-driven starbursts with hot dust temperatures. Once again, because αCO linearly scales with Mdust, correcting for this possible bias will not erase our correlations, but rather strengthen them. In any case, we note that Magnelli et al. (2010, 2012) do not find any significant differences in the dust emissivity of high-redshift SMGs and lensed-SMGs. Magdis et al. (2012) find that the absence of millimeter measurements might affect in a different way the dust mass estimates of normal MS galaxies and SMGs. While for normal MS galaxies the dust masses estimated with or without millimeter measurements are fully consistent, for SMGs they find that without millimeter measurements dust masses seem to be overestimated by a factor of s2. Among the three SMGs of our sample only one has a millimeter measurement. In any case, because this effect would decrease the inferred αCO value of our SMGs, it would strengthen our αCO − Tdust (f60/f100) correlation. Finally, one might argue that Tdust and Mdust being both estimated from the same FIR measurements, they are artificially correlated. For a given set of FIR measurements, higher Tdust would lead to lower values of Mdust and consequently to lower values of αCO. However, we remind the reader that here this effect is at least reduced by the fact that Tdust and Mdust are not directly derived from the same method, the former being derived using a single modified blackbody model and the latter being derived using the DL07 model. We also note that the αCO − f60/f100 and αCO − Δlog (SSFR)MS correlations are not affected by this effect. From all these analyses we conclude that uncertainties on our dust mass estimates could not explain the observed correlations of αCO with Tdust, f60/f100 and Δlog (SSFR)MS.
(iii) Uncertainties on our metallicity estimates:
Mannucci et al. (2010) found that the metallicity of local star-forming galaxies does not only depend on their stellar masses but also on their SFRs. Using metallicities inferred with the “fundamental metallicity relation” of Mannucci et al. (2010) and revised in Genzel et al. (2012) for z s 2 star-forming galaxies, we find no significant change in our correlations. As a second sanity check we assume a constant value for δGDR(μ0) (i.e., independent of the metallicity) and verify that correlations are still observed. Finally we note that to explain the αCO-Tdust correlation with a metallicity effect, all galaxies with cold and hot dust temperature should have low and high metallicities, respectively, and the metallicity range probed by these two galaxy populations should be of s1 dex. This is unlikely, given the small uncertainties on our stellar mass estimates, and the dispersion of the mass-metallicity relation.
We therefore conclude that uncertainties on the δGDR(μ0) relation, on our measured dust masses or on the inferred metallicities, are unlikely to artificially produce the αCO correlations shown in 5. The normalization and slope of the relations are however subject to some of these biases. We find a median value for αCO of 2.5 at the high dust temperature end (Tdust > 30 K), compared to the value of 1.0 found in local major mergers (Solomon et al. 1997; Downes & Solomon 1998). Likewise, at low dust temperatures (Tdust < 30 K) typical of normal star-forming galaxies, the median value of αCO is 10, while a value of 4.34 M⊙ (K km s-1 pc2)-1 is found in the Milky Way (Strong & Mattox 1996; Dame et al. 2001; Leroy et al. 2011; Abdo et al. 2010).
Other than the sources of uncertainty listed above, we identify two other factors that may lead to the systematic overestimation of αCO by a factor of s 2: (i) Leroy et al. (2011) argue that, at fixed metallicity, changes in the dust emissivity and δGDR between the atomic and molecular phases of the ISM may have biased upward, by a factor of 1.5−2, their estimate of δGDR(μ0). Because the gas in high-redshift galaxies is mainly in a molecular phase, we might consider this bias to be specific to their study. Correcting downward the δGDR(μ0) relation of Leroy et al. (2011) by a factor of 1.5−2 would bring our values αCO in line with those in analogous z = 0 systems. (ii) If indeed the atomic gas phase in high-redshift galaxies is negligible, qualitatively its inclusion in Eq. (7) would systematically lead to lower values of αCO.
6. Discussion
Using PdBI CO(2−1) measurements and far-infrared observations from Herschel, we estimate the value of αCO for a sample of 17 high-redshift galaxies, sampling a large region of the SFR-M∗ plane. We find that αCO correlates with dust temperatures (i.e., Tdust) and far-infrared color (i.e., f60/f100). A weaker correlation with the distance from the main sequence of star-formation (i.e., Δlog (SSFR)MS) is also observed. None of these correlations could be explained by systematic biases in our study, although their exact parametrization still remains uncertain. Due to these uncertainties, here we only discuss our correlations in terms of relative variations of αCO with dust temperature, far-infrared color, and distance of a galaxy from the MS.
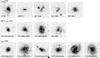 |
Fig. 6 z-band (i.e., F850LP) images from the Hubble Space Telescope for galaxies in our sample with 1.0 < z < 1.6 (i.e., all but two galaxies of our sample). Each image is 40 kpc×40 kpc, and galaxies are ordered based on their dust temperatures. On average, the galaxies with Tdust < 28 K have disk-like morphologies (i.e., PEPJ123709+621507, PEPJ123759+621732, PEPJ123615+621008, PEPJ123646+621141, PEPJ123750+621600) while most of the galaxies with Tdust > 33 K are more compact and irregular/clumpy. |
6.1. The αCO – Tdust and αCO – f60/f100 correlations
Although low CO rotational lines are almost always very optically thick (Dickman et al. 1986; Solomon et al. 1987), it has been shown in the MW and in nearby star-forming galaxies that CO line fluxes can be used to derive total molecular gas masses. The proportionality factor linking LCO to MH2, αCO, can be theoretically inferred using a “virial” approach. At a given metallicity and for a self-gravitating (i.e., virialized) giant molecular cloud (GMC), αCO scales as: 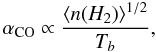 (9)where ⟨ n(H2) ⟩ is the mean hydrogen density and Tb is the CO intrinsic brightness temperature (e.g., Solomon et al. 1987).
Assuming that gas and dust are coupled in GMCs (i.e., Tb ∝ Tdust), Eq. (9) may appear to suggest an anti-correlation between αCO and Tdust. However, observations of clouds in different environments of near-solar metallicity (in the MW and in other nearby normal star-forming galaxies) suggest that variations of ⟨ n(H2) ⟩ are compensated by temperature changes, such that αCO remains constant, with variations of at most a factor of 2 (e.g., Strong & Mattox 1996; Dame et al. 2001; Abdo et al. 2010).
In the local Universe, the only galaxies with near-solar metallicities yet significantly different values of αCO are the ULIRGs. In these extreme merger-driven starbursts, the assumption that molecular gas clouds are in virial equilibrium breaks down, and measurements of αCO suggest a value reduced by a factor of ~5 compared to the Galactic value (see, e.g., Solomon et al. 1997; Downes & Solomon 1998; Scoville et al. 1997; Papadopoulos et al. 2012). The scaling between αCO, ⟨ n(H2) ⟩ , and Tb however still holds, albeit with a lower proportionality factor (Solomon et al. 1997; Downes & Solomon 1998; Sakamoto et al. 1999), indicating that the low αCO values are mostly caused by a modification of the dynamics of their GMCs rather than by the increase in gas/dust temperature (see, e.g., Chapman et al. 2003; Clements et al. 2010; Wang et al. 2011). These results suggest a step function of αCO as a function of Tdust; normal SFGs dominated by virialized GMCs, which in general have cold dust temperatures, have αCO = 4.36 M⊙ (K km s-1 pc2)-1, while merger-driven starbursts, which always exhibit larger Tdust than normal SFGs, would have αCO ~ 1 M⊙ (K km s-1 pc2)-1. This interpretation qualitatively agrees with the step model fitted to our αCO − Tdust and αCO − f60/f100 correlations. It also agrees quantitatively with it because in this model we find that galaxies with hot dust temperatures have αCO values five times lower than those with cold dust temperatures. Finally, we also note that this interpretation might also agree with a simple visual inspection of the morphology of our galaxies (Fig. 6). Galaxies with cold dust temperatures (i.e., Tdust < 28 K) have on average a disk-like morphology characteristic of normal SFGs (i.e., PEPJ123709+621507, PEPJ123759+621732, PEPJ123615+621008, PEPJ123646+ 621141, PEPJ123750+621600), while galaxies with hot dust temperatures tend to be more compact and have disturbed morphologies (i.e., Bzk-4171, Bzk-21000, Bzk-17999) consistent with being major-mergers. Of course this conclusion has to be taken with caution because of low statistics of our sample and the difficulties encountered by any visual morphological classification.
Although satisfactory for our step model, this framework does not directly explain the possible smooth evolution of αCO with Tdust (or equivalently f60/f100), but can be extended to do so. High-redshift galaxies have larger gas fractions than in the local Universe (Tacconi et al. 2010; Daddi et al. 2010; Geach et al. 2011). Under these conditions, simple gravitational instabilities might locally create un-virialized GMCs (Springel et al. 2005; Bournaud et al. 2010). High-redshift galaxies may thus exist through a state where their ISM is a mixture of virialized and un-virialized GMCs (this mixture could either be observed at all physical scales, or else as a central region with un-virialized GMCs surrounded at larger scales by virialized GMCs). The effective Tdust and αCO derived from our unresolved observations would then correspond to a simple linear combination of these two “types” of star-forming regions, the cold virialized and hot un-virialized GMCs, creating the apparent smooth evolution of αCO with Tdust (or equivalently f60/f100). The existence of two “types” of star-forming regions in interacting galaxies has already been found locally in the spatially resolved observations of Arp 158 (Boquien et al. 2011; see also Wei et al. 2012). While most star-forming regions of Arp 158 follow closely the Schmidt-Kennicutt relation found in spiral galaxies, its nuclear starburst and the tip of one of the tidal tails follow more closely the Schmidt-Kennicutt relation observed in merger-driven starbursts. The existence of these two “types” of star-forming regions within the same galaxy seems to favor the interpretation where the smooth αCO − Tdust relation is due to our spatially unresolved observations.
Using hydrodynamic simulations coupled with radiative transfer calculations, Narayanan et al. (2012) also find that αCO might evolve continuously from the Galactic to the merger-driven value. They argue that at high redshifts gas rich galaxies with their large gravitational instabilities probe a larger dynamic range in ISM properties (gas/dust temperatures, density and velocity dispersion) than local galaxies, leading to a smooth evolution of αCO. In particular, they find that mergers of different mass ratios lead to different conversion factors.
While we cannot formally discriminate between a step or a smooth evolution of αCO with the dust temperature or the f60/f100 ratio, we can conclude that either quantity can be used to select an appropriate value of αCO; galaxies with hot dust temperatures unambiguously have lower αCO than galaxies with cold dust temperatures. The main advantage of Tdust for selecting the value of αCO is that it does not rely on the morphological classification of major-mergers/disky SFGs, which can be difficult at high z because clumpy SFGs may be confused with major mergers. Moreover, even if the visual classifications of major-mergers/disky SFGs would be fully accurate, they would still be inefficient in distinguishing starbursting-mergers (i.e., with likely low αCO values) from late mergers with normal mode of star-formation (i.e., with likely high αCOvalues). Indeed, we observe both locally and at high redshift that galaxies with unambiguous morphological signs of merging are not always associated with enhanced star formation activity (e.g., Bushouse et al. 1988; Dasyra et al. 2006; Kartaltepe et al. 2012). In that case, our Tdust criterion would be more indicative of the ISM conditions prevailing in these mergers. We discuss further the implications of this result in Sect. 6.3.
6.2. The αCO − Δ log (SSFR)MS correlation
Currently, it is commonly interpreted that galaxies situated on the main sequence of the SFR-M∗ are consistent with a secular mode of star formation, while star-forming galaxies located far above the MS are powered by strong starbursts with short duty-cycles, likely triggered by major mergers (Elbaz et al. 2011; Nordon et al. 2012; Rodighiero et al. 2011; Wuyts et al. 2011b; Magnelli et al. 2012; Magnelli et al., in prep.). In that view, a correlation between αCO and Δlog (SSFR)MS can therefore be expected: on-MS galaxies should have high αCO values while above-MS galaxies should have low αCO values as those seen in local ULIRGs. Such a correlation is indeed observed in the right panel of Fig. 5, though with a lower Spearman’s correlation factor than those found for Tdust or f60/f100. However, we note that this lower Spearman’s correlation factor might simply reflect the larger uncertainties in deriving Δlog (SSFR)MS than Tdust or f60/f100 (i.e., uncertainties on M∗, SFR and on the exact localization of the MS).
Although we cannot say whether αCO depends on Δlog (SSFR)MS as a smooth or a step function, we can unambiguously conclude that galaxies situated far above the MS have lower value of αCO than galaxies situated on the MS. Using Δlog (SSFR)MS as a proxy of the αCO value will be of great importance in the near future especially where deep PACS-SPIRE Herschel observations are missing to derive Tdust and f60/f100.
The observed αCO-Δlog (SSFR)MS correlation also directly confirms the current interpretation that galaxies on the main sequence are in a secular/steadier mode of star-formation, while off-MS galaxies are in a starbursting mode likely triggered by major mergers. However, Narayanan et al. (2012) argue that high-z galaxies, having high gas surface densities and strong gravitational instabilities, could have low αCO values without requiring a major-merger. In any case, our observations allow us to conclude that the different mechanisms having the power to raise a galaxy above the main sequence must also affect the mode of star-formation and the physical conditions prevailing in the star-forming regions. This interpretation is also supported by the observation that galaxies on and above the star formation MS have significantly different PAH abundances (Nordon et al. 2012) and star-formation rate surface densities (Wuyts et al. 2011b), other tracers of physical conditions in the ISM.
6.3. Implications for future work
Our observations confirm that at high redshift, just like in the local Universe, the value of αCO varies between galaxies with different star formation properties, corroborating results based on dynamical mass estimates in SMGs (Tacconi et al. 2008). Applying a Galactic αCO to starbursting galaxies would not only lead to unrealistically high gas mass fractions (Genzel et al. 2010), but also to high δGDR(μ0) values, inconsistent with local observations and chemical evolution models.
More importantly, our results provide an empiral way to select the appropriate value of αCO, using Tdust or f60/f100. These indicators have the great advantage of being less subjective than visual morphological classifications of mergers/SFGs, and more indicative of ISM conditions than a fixed LIR criterion. In the absence of far-infrared measurements to derive dust properties, the offset of a galaxy from the star formation main sequence, Δlog (SSFR)MS, is also a valid indicator.
The galaxies studied here all have near-solar metallicities, as estimated using the mass-metallicity relation. However, both observations and models show that αCO increases in low metallicity environments due to the photodissociation of CO, which lacks the power of H2 to self-shield against radiation even when dust shielding becomes deficient (e.g., Genzel et al. 2012; Glover & Mac Low 2011; Narayanan et al. 2011; Schruba et al. 2012). The presence of an αCO-Tdust correlation has yet to be tested at low metallicities, where the main driver of αCO is the availability or not of dust shielding. One could expect αCO to vary along a plane defined by Tdust and metallicity, as suggested by the simulations of Narayanan et al. (2012), where a correlation between αCO, gas surface density and merger mass ratio is observed even in low metallicity environments.
The choice of αCO also has implications for the Schmidt-Kennicutt star formation relation, where SFGs and starbursting major-mergers form two distinct sequences (Genzel et al. 2010; Daddi et al. 2010; but see Ivison et al. 2011). If αCO evolves with the dust temperature (or alternatively f60/f100 or Δlog (SSFR)MS) as a step function, it will not modify this observation. Adopting a value of αCO that varies smoothly with e.g., Tdust would not significantly change those results. However, it would lead to a smoother transition where starbursting mergers with lower mass ratios or gas-rich disks with extreme gravitational instabilities would lie between these two sequences.
7. Summary
We have combined deep Herschel PACS/SPIRE imaging and IRAM PdBI CO(2−1) measurements for a sample of 17 galaxies at z > 1.0, selected out of the GOODS-N field to span a broad region of the SFR-M∗ plane. The far-infrared data were used to derive accurate dust masses from the model of Draine & Li (2007), while dust temperatures are recovered from the fitting of modified blackbody functions of fixed dust emissivity β = 1.5.
Using the prescription of Leroy et al. (2011) for the metallicity-dependence of the gas-to-dust ratio, the measured dust masses and the CO luminosities, we inferred the value of αCO in each of the galaxies. The conversion factor is found to vary systematically with dust temperature and far-infrared color, two tracers of the physical conditions in star-forming regions. We also found a weaker correlation between αCO and Δlog (SSFR)MS, the distance from the sequence traced by star-forming galaxies in the SFR-M∗plane. We have investigated in detail possible systematic biases in the analysis, but find none that can convincingly explain these correlations.
The results are consistent with previous observations indicating that in normal star-forming galaxies of near-solar metallicities αCO is mostly constant as long as star formation takes place in well virialized GMCs, while in major merger-driven starbursts where gas is compressed and dust temperatures are higher, the value of αCO is decreased by a factor of ~5. However, our measurements of αCO are consistent not only with a step function, but also with being a smooth function of Tdust. This smooth evolution may come from the fact that we are working with integrated measurements tracing the average conditions in the galaxies. Either merging events with low mass ratios, or gravitational instabilities within the very gas-rich discs could lead to a situation where, within a single galaxy, some star formation is taking place within normal GMCs while some stars are also formed in dense, hot regions. The integrated values of αCO and Tdust would then be expected to vary anywhere between the Galactic and the “starburst” values, producing the smooth relation we observe. Alternatively, conditions may be changing at the scale of the star forming regions such that the αCO-Tdust relation would be recovered by resolved observations at the sub-kiloparsec scale.
Regardless of the exact functional form of the dependence of αCO on Tdust, our study clearly shows that dust temperature (or equivalently the f60/f100 ratio) can be used to assign a single conversion factor value to any galaxy. Such a criterion is valuable, as it traces the physical conditions of the ISM more reliably than a simple SFR or LIR criterion. It is also valuable because it is less subjective than methods requiring challenging visual classifications of major mergers which furthermore cannot easily distinguish between mergers in a starbursting phase from those in a normal phase of star-formation. In the absence of far-infrared measurements to derive dust properties, the distance of a galaxy from the star formation main sequence can be used to make a choice between a Galactic conversion factor (αCO = 4.36 M⊙ (K km s-1 pc2)-1, including the contribution of Helium) and a “starburst” value (αCO = 1.0 M⊙ (K km s-1 pc2)-1). While most galaxies located above the main sequence are major mergers, other mechanisms may generate bursts of star formation powerful enough to displace the galaxies in the SFR-M∗ plane. Our results however indicate that any such mechanism does so by modifying the effective mode of star formation and the physical conditions prevailing in the sites of star formation.
We note among these 8 galaxies, BzK-21000 and GN20 were initially analyzed in Magdis et al. (2011), while the remaining 6 are also presented in Madgis et al. (2012).
Results of Rodighiero et al. (2010) are corrected for different IMF assumptions, namely from an Salpeter IMF in Rodighiero et al. (2010) to a Chabrier (2003) IMF in our study. Thus, SFRs and stellar masses from Rodighiero et al. (2010) are divided by a factor 1.7.
publicly available at http://www.mpe.mpg.de/ir/Research/PEP/
It corresponds to a  ratio of 0.75, where Tb is the equivalent Rayleigh-Jeans brightness temperature.
We note that all the values of αCO quoted in this paper already include an upward factor of 1.36 to account for the presence of Helium coexisting with the molecular hydrogen.
Acknowledgments
We thank the staff of the IRAM Observatory in Grenoble for their support in preparing and conducting the observations, and in particular Yannick Libert and Jan-Martin Winters for assistance with data reduction. PACS has been developed by a consortium of institutes led by MPE (Germany) and including UVIE (Austria); KU Leuven, CSL, IMEC (Belgium); CEA, LAM (France); MPIA (Germany); INAF – IFSI/OAA/OAP/OAT, LENS, SISSA (Italy); IAC (Spain). This development has been supported by the funding agencies BMVIT (Austria), ESA-PRODEX (Belgium), CEA/CNES (France), DLR (Germany), ASI/INAF (Italy), and CICYT/MCYT (Spain). SPIRE has been developed by a consortium of institutes led by Cardiff University (UK) and including University of Lethbridge (Canada), NAOC (PR China), CEA, LAM (France), IFSI, University of Padua (Italy), IAC (Spain), Stockholm Observatory (Sweden), Imperial College London, RAL, UCL-MSSL, UKATC, University of Sussex (UK), Caltech, JPL, NHSC, University of Colorado (USA). This development has been supported by national funding agencies: CSA (Canada); NAOC (PR China); CEA, CNES, CNRS (France); ASI (Italy); MCINN (Spain); SNSB (Sweden); STFC, UKSA (UK) and NASA (USA).
References
- Abdo, A. A., Ackermann, M., Ajello, M., et al. 2010, ApJ, 710, 133 [NASA ADS] [CrossRef] [Google Scholar]
- Aravena, M., Carilli, C., Daddi, E., et al. 2010, ApJ, 718, 177 [NASA ADS] [CrossRef] [Google Scholar]
- Arce, H. G., & Goodman, A. A. 1999, ApJ, 512, L135 [NASA ADS] [CrossRef] [Google Scholar]
- Barger, A. J., Cowie, L. L., & Wang, W.-H. 2008, ApJ, 689, 687 [NASA ADS] [CrossRef] [Google Scholar]
- Berta, S., Magnelli, B., Lutz, D., et al. 2010, A&A, 518, L30 [NASA ADS] [CrossRef] [EDP Sciences] [Google Scholar]
- Berta, S., Magnelli, B., Nordon, R., et al. 2011, A&A, 532, A49 [NASA ADS] [CrossRef] [EDP Sciences] [Google Scholar]
- Bigiel, F., Leroy, A., Walter, F., et al. 2008, AJ, 136, 2846 [NASA ADS] [CrossRef] [Google Scholar]
- Blitz, L., & Rosolowsky, E. 2006, ApJ, 650, 933 [NASA ADS] [CrossRef] [Google Scholar]
- Bolatto, A. D., Leroy, A. K., Rosolowsky, E., Walter, F., & Blitz, L. 2008, ApJ, 686, 948 [NASA ADS] [CrossRef] [Google Scholar]
- Bolatto, A. D., Leroy, A. K., Jameson, K., et al. 2011, ApJ, 741, 12 [NASA ADS] [CrossRef] [Google Scholar]
- Boquien, M., Lisenfeld, U., Duc, P.-A., et al. 2011, A&A, 533, A19 [NASA ADS] [CrossRef] [EDP Sciences] [Google Scholar]
- Bothwell, M. S., Smail, I., Chapman, S. C., et al. 2012, MNRAS, submitted [arXiv:1205.1511] [Google Scholar]
- Bournaud, F., Elmegreen, B. G., Teyssier, R., Block, D. L., & Puerari, I. 2010, MNRAS, 409, 1088 [NASA ADS] [CrossRef] [Google Scholar]
- Brammer, G. B., van Dokkum, P. G., & Coppi, P. 2008, ApJ, 686, 1503 [NASA ADS] [CrossRef] [Google Scholar]
- Brinchmann, J., Charlot, S., White, S. D. M., et al. 2004, MNRAS, 351, 1151 [NASA ADS] [CrossRef] [Google Scholar]
- Bruzual, G., & Charlot, S. 2003, MNRAS, 344, 1000 [NASA ADS] [CrossRef] [Google Scholar]
- Bushouse, H. A., Werner, M. W., & Lamb, S. A. 1988, ApJ, 335, 74 [NASA ADS] [CrossRef] [Google Scholar]
- Cambrésy, L., Jarrett, T. H., & Beichman, C. A. 2005, A&A, 435, 131 [NASA ADS] [CrossRef] [EDP Sciences] [Google Scholar]
- Carilli, C. L., Daddi, E., Riechers, D., et al. 2010, ApJ, 714, 1407 [NASA ADS] [CrossRef] [Google Scholar]
- Chabrier, G. 2003, ApJ, 586, L133 [NASA ADS] [CrossRef] [Google Scholar]
- Chakrabarti, S., & McKee, C. F. 2008, ApJ, 683, 693 [NASA ADS] [CrossRef] [Google Scholar]
- Chapman, S. C., Helou, G., Lewis, G. F., & Dale, D. A. 2003, ApJ, 588, 186 [NASA ADS] [CrossRef] [Google Scholar]
- Clements, D. L., Dunne, L., & Eales, S. 2010, MNRAS, 403, 274 [NASA ADS] [CrossRef] [Google Scholar]
- Daddi, E., Dickinson, M., Morrison, G., et al. 2007, ApJ, 670, 156 [NASA ADS] [CrossRef] [Google Scholar]
- Daddi, E., Elbaz, D., Walter, F., et al. 2010, ApJ, 714, L118 [Google Scholar]
- Dale, D. A., Helou, G., Contursi, A., Silbermann, N. A., & Kolhatkar, S. 2001, ApJ, 549, 215 [NASA ADS] [CrossRef] [Google Scholar]
- Dale, D. A., Aniano, G., Engelbracht, C. W., et al. 2012, ApJ, 745, 95 [NASA ADS] [CrossRef] [Google Scholar]
- Dame, T. M., Hartmann, D., & Thaddeus, P. 2001, ApJ, 547, 792 [NASA ADS] [CrossRef] [Google Scholar]
- Dasyra, K. M., Tacconi, L. J., Davies, R. I., et al. 2006, ApJ, 638, 745 [NASA ADS] [CrossRef] [Google Scholar]
- Davé, R., Finlator, K., Oppenheimer, B. D., et al. 2010, MNRAS, 404, 1355 [NASA ADS] [Google Scholar]
- Dekel, A., Birnboim, Y., Engel, G., et al. 2009, Nature, 457, 451 [NASA ADS] [CrossRef] [PubMed] [Google Scholar]
- Denicoló, G., Terlevich, R., & Terlevich, E. 2002, MNRAS, 330, 69 [NASA ADS] [CrossRef] [Google Scholar]
- Dickman, R. L., Snell, R. L., & Schloerb, F. P. 1986, ApJ, 309, 326 [NASA ADS] [CrossRef] [Google Scholar]
- Downes, D., & Solomon, P. M. 1998, ApJ, 507, 615 [NASA ADS] [CrossRef] [Google Scholar]
- Draine, B. T., & Li, A. 2007, ApJ, 657, 810 [NASA ADS] [CrossRef] [Google Scholar]
- Dutra, C. M., Ahumada, A. V., Clariá, J. J., Bica, E., & Barbuy, B. 2003, A&A, 408, 287 [NASA ADS] [CrossRef] [EDP Sciences] [Google Scholar]
- Elbaz, D., Daddi, E., Le Borgne, D., et al. 2007, A&A, 468, 33 [NASA ADS] [CrossRef] [EDP Sciences] [Google Scholar]
- Elbaz, D., Dickinson, M., Hwang, H. S., et al. 2011, A&A, 533, A119 [NASA ADS] [CrossRef] [EDP Sciences] [Google Scholar]
- Engel, H., Tacconi, L. J., Davies, R. I., et al. 2010, ApJ, 724, 233 [NASA ADS] [CrossRef] [Google Scholar]
- Erb, D. K., Steidel, C. C., Shapley, A. E., et al. 2006, ApJ, 647, 128 [NASA ADS] [CrossRef] [Google Scholar]
- Frayer, D. T., Koda, J., Pope, A., et al. 2008, ApJ, 680, L21 [NASA ADS] [CrossRef] [Google Scholar]
- Gao, Y., & Solomon, P. M. 2004, ApJ, 606, 271 [NASA ADS] [CrossRef] [Google Scholar]
- Geach, J. E., Smail, I., Moran, S. M., et al. 2011, ApJ, 730, L19 [NASA ADS] [CrossRef] [Google Scholar]
- Genzel, R., Tacconi, L. J., Gracia-Carpio, J., et al. 2010, MNRAS, 407, 2091 [NASA ADS] [CrossRef] [Google Scholar]
- Genzel, R., Tacconi, L. J., Combes, F., et al. 2012, ApJ, 746, 69 [NASA ADS] [CrossRef] [Google Scholar]
- Glover, S. C. O., & Mac Low, M.-M. 2011, MNRAS, 412, 337 [NASA ADS] [CrossRef] [MathSciNet] [Google Scholar]
- Graciá-Carpio, J., Sturm, E., Hailey-Dunsheath, S., et al. 2011, ApJ, 728, L7 [NASA ADS] [CrossRef] [Google Scholar]
- Greve, T. R., Pope, A., Scott, D., et al. 2008, MNRAS, 389, 1489 [NASA ADS] [CrossRef] [Google Scholar]
- Guilloteau, S., Delannoy, J., Downes, D., et al. 1992, A&A, 262, 624 [NASA ADS] [Google Scholar]
- Hayward, C. C., Jonsson, P., Kereš, D., et al. 2012, MNRAS, 424, 951 [NASA ADS] [CrossRef] [Google Scholar]
- Israel, F. P. 1997, A&A, 328, 471 [NASA ADS] [Google Scholar]
- Israel, F. 2000, in Molecular Hydrogen in Space, eds. F. Combes, & G. Pineau Des Forets, 293 [Google Scholar]
- Ivison, R. J., Papadopoulos, P. P., Smail, I., et al. 2011, MNRAS, 412, 1913 [NASA ADS] [CrossRef] [Google Scholar]
- Jenkins, E. B. 2009, ApJ, 700, 1299 [NASA ADS] [CrossRef] [Google Scholar]
- Johansson, L. E. B., Greve, A., Booth, R. S., et al. 1998, A&A, 331, 857 [NASA ADS] [Google Scholar]
- Karim, A., Schinnerer, E., Martínez-Sansigre, A., et al. 2011, ApJ, 730, 61 [NASA ADS] [CrossRef] [Google Scholar]
- Kartaltepe, J. S., Dickinson, M., Alexander, D. M., et al. 2012, ApJ, 757, 23 [CrossRef] [Google Scholar]
- Kewley, L. J., & Ellison, S. L. 2008, ApJ, 681, 1183 [NASA ADS] [CrossRef] [Google Scholar]
- Kriek, M., van Dokkum, P. G., Labbé, I., et al. 2009, ApJ, 700, 221 [NASA ADS] [CrossRef] [Google Scholar]
- Leroy, A. K., Walter, F., Brinks, E., et al. 2008, AJ, 136, 2782 [NASA ADS] [CrossRef] [Google Scholar]
- Leroy, A. K., Walter, F., Bigiel, F., et al. 2009, AJ, 137, 4670 [NASA ADS] [CrossRef] [Google Scholar]
- Leroy, A. K., Bolatto, A., Gordon, K., et al. 2011, ApJ, 737, 12 [NASA ADS] [CrossRef] [Google Scholar]
- Li, A., & Draine, B. T. 2001, ApJ, 554, 778 [Google Scholar]
- Liu, X., Shapley, A. E., Coil, A. L., Brinchmann, J., & Ma, C.-P. 2008, ApJ, 678, 758 [NASA ADS] [CrossRef] [Google Scholar]
- Lutz, D., Poglitsch, A., Altieri, B., et al. 2011, A&A, 532, A90 [NASA ADS] [CrossRef] [EDP Sciences] [Google Scholar]
- Magdis, G. E., Rigopoulou, D., Huang, J.-S., & Fazio, G. G. 2010, MNRAS, 401, 1521 [NASA ADS] [CrossRef] [Google Scholar]
- Magdis, G. E., Daddi, E., Elbaz, D., et al. 2011, ApJ, 740, L15 [Google Scholar]
- Magdis, G. E., Daddi, E., Bethermin, M., et al. 2012, ApJ, accepted [arXiv:1210.1035M] [Google Scholar]
- Magnelli, B., Elbaz, D., Chary, R. R., et al. 2009, A&A, 496, 57 [NASA ADS] [CrossRef] [EDP Sciences] [Google Scholar]
- Magnelli, B., Lutz, D., Berta, S., et al. 2010, A&A, 518, L28 [NASA ADS] [CrossRef] [EDP Sciences] [Google Scholar]
- Magnelli, B., Elbaz, D., Chary, R. R., et al. 2011, A&A, 528, A35 [Google Scholar]
- Magnelli, B., Lutz, D., Santini, P., et al. 2012, A&A, 539, A155 [NASA ADS] [CrossRef] [EDP Sciences] [Google Scholar]
- Maloney, P., & Black, J. H. 1988, ApJ, 325, 389 [NASA ADS] [CrossRef] [Google Scholar]
- Mancini, C., Förster Schreiber, N. M., Renzini, A., et al. 2011, ApJ, 743, 86 [NASA ADS] [CrossRef] [Google Scholar]
- Mannucci, F., Cresci, G., Maiolino, R., Marconi, A., & Gnerucci, A. 2010, MNRAS, 408, 2115 [NASA ADS] [CrossRef] [Google Scholar]
- Michałowski, M. J., Watson, D., & Hjorth, J. 2010, ApJ, 712, 942 [NASA ADS] [CrossRef] [Google Scholar]
- Muñoz-Mateos, J. C., Gilde Paz, A., Boissier, S., et al. 2009, ApJ, 701, 1965 [NASA ADS] [CrossRef] [Google Scholar]
- Narayanan, D., Krumholz, M., Ostriker, E. C., & Hernquist, L. 2011, MNRAS, 418, 664 [NASA ADS] [CrossRef] [Google Scholar]
- Narayanan, D., Krumholz, M. R., Ostriker, E. C., & Hernquist, L. 2012, MNRAS, 421, 3127 [NASA ADS] [CrossRef] [Google Scholar]
- Noeske, K. G., Weiner, B. J., Faber, S. M., et al. 2007, ApJ, 660, L43 [Google Scholar]
- Nordon, R., Lutz, D., Genzel, R., et al. 2012, ApJ, 745, 182 [NASA ADS] [CrossRef] [Google Scholar]
- Obreschkow, D., & Rawlings, S. 2009, ApJ, 696, L129 [NASA ADS] [CrossRef] [Google Scholar]
- Oliver, S., Frost, M., Farrah, D., et al. 2010, MNRAS, 405, 2279 [NASA ADS] [Google Scholar]
- Pannella, M., Carilli, C. L., Daddi, E., et al. 2009, ApJ, 698, L116 [Google Scholar]
- Papadopoulos, P. P., van der Werf, P., Xilouris, E., Isaak, K. G., & Gao, Y. 2012, ApJ, 751, 10 [NASA ADS] [CrossRef] [Google Scholar]
- Penner, K., Pope, A., Chapin, E. L., et al. 2011, MNRAS, 410, 2749 [NASA ADS] [CrossRef] [Google Scholar]
- Perera, T. A., Chapin, E. L., Austermann, J. E., et al. 2008, MNRAS, 391, 1227 [NASA ADS] [CrossRef] [Google Scholar]
- Pope, A., Scott, D., Dickinson, M., et al. 2006, MNRAS, 370, 1185 [NASA ADS] [CrossRef] [Google Scholar]
- Rieke, G. H., Young, E. T., Engelbracht, C. W., et al. 2004, ApJS, 154, 25 [NASA ADS] [CrossRef] [Google Scholar]
- Rodighiero, G., Cimatti, A., Gruppioni, C., et al. 2010, A&A, 518, L25 [NASA ADS] [CrossRef] [EDP Sciences] [Google Scholar]
- Rodighiero, G., Daddi, E., Baronchelli, I., et al. 2011, ApJ, 739, L40 [NASA ADS] [CrossRef] [Google Scholar]
- Saintonge, A., Kauffmann, G., Kramer, C., et al. 2011a, MNRAS, 415, 32 [NASA ADS] [CrossRef] [Google Scholar]
- Saintonge, A., Kauffmann, G., Wang, J., et al. 2011b, MNRAS, 415, 61 [NASA ADS] [CrossRef] [Google Scholar]
- Sakamoto, K., Scoville, N. Z., Yun, M. S., et al. 1999, ApJ, 514, 68 [NASA ADS] [CrossRef] [Google Scholar]
- Sanders, D. B., & Mirabel, I. F. 1985, ApJ, 298, L31 [NASA ADS] [CrossRef] [Google Scholar]
- Sanders, D. B., Scoville, N. Z., & Soifer, B. T. 1991, ApJ, 370, 158 [NASA ADS] [CrossRef] [Google Scholar]
- Sanders, D. B., Mazzarella, J. M., Kim, D.-C., Surace, J. A., & Soifer, B. T. 2003, AJ, 126, 1607 [Google Scholar]
- Santini, P., Maiolino, R., Magnelli, B., et al. 2010, A&A, 518, L154 [NASA ADS] [CrossRef] [EDP Sciences] [Google Scholar]
- Schaye, J. 2004, ApJ, 609, 667 [NASA ADS] [CrossRef] [Google Scholar]
- Schiminovich, D., Wyder, T. K., Martin, D. C., et al. 2007, ApJS, 173, 315 [NASA ADS] [CrossRef] [Google Scholar]
- Schruba, A., Leroy, A. K., Walter, F., et al. 2012, AJ, 143, 138 [NASA ADS] [CrossRef] [Google Scholar]
- Scoville, N. Z., Yun, M. S., & Bryant, P. M. 1997, ApJ, 484, 702 [NASA ADS] [CrossRef] [Google Scholar]
- Shapley, A. E., Coil, A. L., Ma, C.-P., & Bundy, K. 2005, ApJ, 635, 1006 [NASA ADS] [CrossRef] [Google Scholar]
- Shetty, R., Glover, S. C., Dullemond, C. P., & Klessen, R. S. 2011a, MNRAS, 412, 1686 [NASA ADS] [CrossRef] [MathSciNet] [Google Scholar]
- Shetty, R., Glover, S. C., Dullemond, C. P., et al. 2011b, MNRAS, 415, 3253 [NASA ADS] [CrossRef] [Google Scholar]
- Solomon, P. M., Rivolo, A. R., Barrett, J., & Yahil, A. 1987, ApJ, 319, 730 [NASA ADS] [CrossRef] [Google Scholar]
- Solomon, P. M., Downes, D., Radford, S. J. E., & Barrett, J. W. 1997, ApJ, 478, 144 [NASA ADS] [CrossRef] [Google Scholar]
- Springel, V., Di Matteo, T., & Hernquist, L. 2005, MNRAS, 361, 776 [NASA ADS] [CrossRef] [Google Scholar]
- Strong, A. W., & Mattox, J. R. 1996, A&A, 308, L21 [NASA ADS] [Google Scholar]
- Tacconi, L. J., Genzel, R., Smail, I., et al. 2008, ApJ, 680, 246 [NASA ADS] [CrossRef] [PubMed] [Google Scholar]
- Tacconi, L. J., Genzel, R., Neri, R., et al. 2010, Nature, 463, 781 [Google Scholar]
- Wang, W.-H., Cowie, L. L., Barger, A. J., & Williams, J. P. 2011, ApJ, 726, L18 [NASA ADS] [CrossRef] [Google Scholar]
- Wei, L. H., Keto, E., & Ho, L. C. 2012, ApJ, 750, 136 [NASA ADS] [CrossRef] [Google Scholar]
- Wilson, G. W., Austermann, J. E., Perera, T. A., et al. 2008, MNRAS, 386, 807 [Google Scholar]
- Wolfire, M. G., Hollenbach, D., & McKee, C. F. 2010, ApJ, 716, 1191 [NASA ADS] [CrossRef] [Google Scholar]
- Wong, T., & Blitz, L. 2002, ApJ, 569, 157 [NASA ADS] [CrossRef] [Google Scholar]
- Wuyts, S., Förster Schreiber, N. M., Lutz, D., et al. 2011a, ApJ, 738, 106 [NASA ADS] [CrossRef] [Google Scholar]
- Wuyts, S., Förster Schreiber, N. M., van der Wel, A., et al. 2011b, ApJ, 742, 96 [NASA ADS] [CrossRef] [Google Scholar]
All Tables
Parameter values of the αCO − Tdust, αCO − f60/f100 and αCO-Δlog (SSFR)MS correlations
All Figures
|
Fig. 1 (Left) The z ~ 1 star formation main sequence from Rodighiero et al. (2010) and the position of the GOODS-N sample with CO measurements and PACS/SPIRE photometry. Galaxies with new IRAM CO observations are shown as black circles while the red symbols are for galaxies with CO data from the literature (Frayer et al. 2008; Daddi et al. 2010; Carilli et al. 2010; Ivison et al. 2011). Among the red symbols, triangles stand for galaxies referred to SMGs. (Right) Distribution of distance from the star formation main sequence (Δlog (SSFR)MS), for the galaxies with the new IRAM CO observations (dashed histogram), and the combined sample including galaxies CO measurements from the literature (open histogram). Bins of 0.25 dex in Δlog (SSFR)MS are used. |
| In the text | |
|
Fig. 2 CO(2−1) spectrum (left), integrated line map (center left panel), line flux versus WCO (center right panel) and signal over noise (S/N) versus WCO (right) of our 7 PdBI targets with secure (PEPJ123712+621753, PEPJ123759+621732, PEPJ123646+621141 and PEPJ123750+621600) and tentative line detection (PEPJ123709+621507, PEPJ123721+621346 and PEPJ123633+621005). In each spectrum, the yellow area displays the part of the spectrum over which the line fluxes are integrated. Dashed lines in the right two panels outline this value of WCO. To create the center right and right panels, we fixed the central frequency when increasing WCO to the central frequency of the yellow area displayed in the left panel. Dotted-dashed lines and triple-dotted-dashed lines represent the line flux and error of each object, respectively. Beam sizes are displayed in the lower left corner of each integrated line map. |
| In the text | |
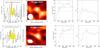 |
Fig. 3 Figure 2 continued. |
| In the text | |
|
Fig. 4 Comparison of the dust masses estimated using the DL07 model with those estimated using a single temperature modified blackbody function. The solid line corresponds to the one-to-one relation while the dashed line is offset by a factor 3. We quote the geometric mean of Mdust across the region of parameter space where |
| In the text | |
|
Fig. 5 αCO(1−0) as function of metallicity (i.e., μ0), dust temperature derived from fitting a single modified blackbody function (i.e., Tdust, see Sect. 4.2), rest-frame far-infrared color (i.e., f60/f100) and distance with respect to the main sequence of star-formation (i.e., Δlog (SSFR)MS). Filled and opened circles represent our 4 secure and 3 tentative IRAM CO detections, respectively. Our 2 IRAM CO upper limits are shown by arrows. BzK galaxies and SMGs are shown by filled squares and triangles, respectively. The shaded area in panel a) represents the αCO(1−0) − μ0 relation and its 1σ uncertainty as found in Genzel et al. (2012). The shaded area in panel d) represents the 1σ scatter around the MS of Rodighiero et al. (2010). The grey line in panel c) represents the empirical αCO(1−0) − f60/f100 relation observed in the local Universe by Graciá-Carpio et al. (2011). Red lines in panel b), c) and d) present fits to the data points using a constant (dashed-triple-dotted line), a step (dashed-dotted line) and a linear (solid) function. Red lines are intentionally limited to the parameter space in which we have direct constraints. |
| In the text | |
|
Fig. 6 z-band (i.e., F850LP) images from the Hubble Space Telescope for galaxies in our sample with 1.0 < z < 1.6 (i.e., all but two galaxies of our sample). Each image is 40 kpc×40 kpc, and galaxies are ordered based on their dust temperatures. On average, the galaxies with Tdust < 28 K have disk-like morphologies (i.e., PEPJ123709+621507, PEPJ123759+621732, PEPJ123615+621008, PEPJ123646+621141, PEPJ123750+621600) while most of the galaxies with Tdust > 33 K are more compact and irregular/clumpy. |
| In the text | |
Current usage metrics show cumulative count of Article Views (full-text article views including HTML views, PDF and ePub downloads, according to the available data) and Abstracts Views on Vision4Press platform.
Data correspond to usage on the plateform after 2015. The current usage metrics is available 48-96 hours after online publication and is updated daily on week days.
Initial download of the metrics may take a while.