Fig. 1
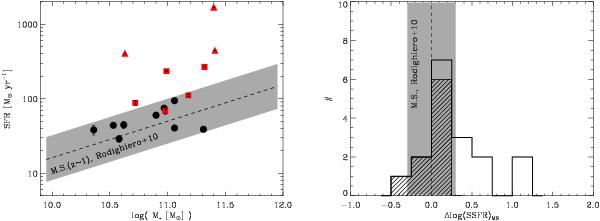
(Left) The z ~ 1 star formation main sequence from Rodighiero et al. (2010) and the position of the GOODS-N sample with CO measurements and PACS/SPIRE photometry. Galaxies with new IRAM CO observations are shown as black circles while the red symbols are for galaxies with CO data from the literature (Frayer et al. 2008; Daddi et al. 2010; Carilli et al. 2010; Ivison et al. 2011). Among the red symbols, triangles stand for galaxies referred to SMGs. (Right) Distribution of distance from the star formation main sequence (Δlog (SSFR)MS), for the galaxies with the new IRAM CO observations (dashed histogram), and the combined sample including galaxies CO measurements from the literature (open histogram). Bins of 0.25 dex in Δlog (SSFR)MS are used.
Current usage metrics show cumulative count of Article Views (full-text article views including HTML views, PDF and ePub downloads, according to the available data) and Abstracts Views on Vision4Press platform.
Data correspond to usage on the plateform after 2015. The current usage metrics is available 48-96 hours after online publication and is updated daily on week days.
Initial download of the metrics may take a while.