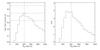
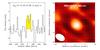
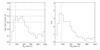
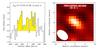
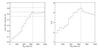
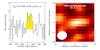
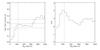
Fig. 2
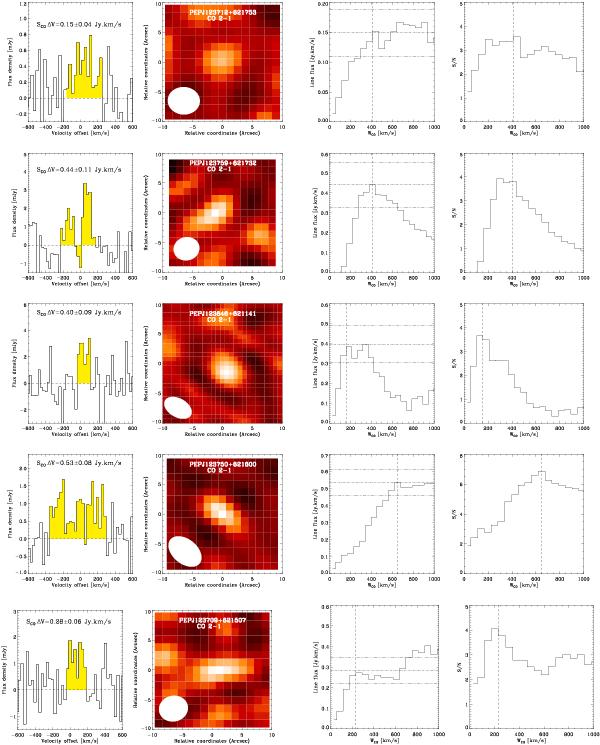
CO(2−1) spectrum (left), integrated line map (center left panel), line flux versus WCO (center right panel) and signal over noise (S/N) versus WCO (right) of our 7 PdBI targets with secure (PEPJ123712+621753, PEPJ123759+621732, PEPJ123646+621141 and PEPJ123750+621600) and tentative line detection (PEPJ123709+621507, PEPJ123721+621346 and PEPJ123633+621005). In each spectrum, the yellow area displays the part of the spectrum over which the line fluxes are integrated. Dashed lines in the right two panels outline this value of WCO. To create the center right and right panels, we fixed the central frequency when increasing WCO to the central frequency of the yellow area displayed in the left panel. Dotted-dashed lines and triple-dotted-dashed lines represent the line flux and error of each object, respectively. Beam sizes are displayed in the lower left corner of each integrated line map.
Current usage metrics show cumulative count of Article Views (full-text article views including HTML views, PDF and ePub downloads, according to the available data) and Abstracts Views on Vision4Press platform.
Data correspond to usage on the plateform after 2015. The current usage metrics is available 48-96 hours after online publication and is updated daily on week days.
Initial download of the metrics may take a while.