Fig. 5
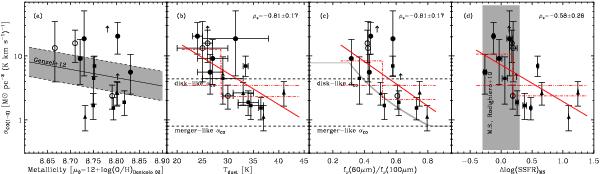
αCO(1−0) as function of metallicity (i.e., μ0), dust temperature derived from fitting a single modified blackbody function (i.e., Tdust, see Sect. 4.2), rest-frame far-infrared color (i.e., f60/f100) and distance with respect to the main sequence of star-formation (i.e., Δlog (SSFR)MS). Filled and opened circles represent our 4 secure and 3 tentative IRAM CO detections, respectively. Our 2 IRAM CO upper limits are shown by arrows. BzK galaxies and SMGs are shown by filled squares and triangles, respectively. The shaded area in panel a) represents the αCO(1−0) − μ0 relation and its 1σ uncertainty as found in Genzel et al. (2012). The shaded area in panel d) represents the 1σ scatter around the MS of Rodighiero et al. (2010). The grey line in panel c) represents the empirical αCO(1−0) − f60/f100 relation observed in the local Universe by Graciá-Carpio et al. (2011). Red lines in panel b), c) and d) present fits to the data points using a constant (dashed-triple-dotted line), a step (dashed-dotted line) and a linear (solid) function. Red lines are intentionally limited to the parameter space in which we have direct constraints.
Current usage metrics show cumulative count of Article Views (full-text article views including HTML views, PDF and ePub downloads, according to the available data) and Abstracts Views on Vision4Press platform.
Data correspond to usage on the plateform after 2015. The current usage metrics is available 48-96 hours after online publication and is updated daily on week days.
Initial download of the metrics may take a while.