| Issue |
A&A
Volume 544, August 2012
|
|
|---|---|---|
| Article Number | L19 | |
| Number of page(s) | 4 | |
| Section | Letters | |
| DOI | https://doi.org/10.1051/0004-6361/201219937 | |
| Published online | 17 August 2012 | |
Mid-J CO emission from the Orion BN/KL explosive outflow
1 Max-Planck-Institut für Radioastronomie (MPIfR), Auf dem Hügel 69, 53121 Bonn, Germany
2 Univ. Bordeaux, LAB, UMR 5804, 33270 Floirac, France
3 CNRS, LAB, UMR 5804, 33270 Floirac, France
e-mail: This email address is being protected from spambots. You need JavaScript enabled to view it.
4 Centro de Radioastronomía y Astrofísica, Universidad Nacional Autónoma de México, 58090 Morelia, Mexico
Received: 2 July 2012
Accepted: 27 July 2012
Abstract
High spatial resolution low-J12CO observations have shown that the wide-angle outflow seen in the Orion BN/KL region correlates with the famous H2 fingers. Recently, high-resolution large-scale mappings of mid- and higher-J CO emissions have been reported toward the Orion molecular cloud 1 core region using the APEX telescope. Therefore, it is of interest to investigate this outflow in the higher-J12CO emission, which is likely excited by shocks. The observations were carried out using the dual-color heterodyne array CHAMP+ on the APEX telescope. The images of the Orion BN/KL region were obtained in the 12CO J = 6−5 and J = 7−6 transitions with angular resolutions of  and
and  , respectively. The results show a good agreement between our higher-J12CO emission and SMA low-J12CO data, which indicates that this wide-angle outflow in Orion BN/KL is likely the result of an explosive event that is related to the runaway objects from a dynamically decayed multiple system. From our observations, we estimate that the kinetic energy of this explosive outflow is about 1−2 × 1047 erg. In addition, a scenario has been proposed where part of the outflow is decelerated and absorbed in the cloud to explain the lack of CO bullets in the southern part of BN/KL, which in turn induces the methanol masers seen in this region.
Key words: ISM: molecules / HII regions / ISM: jets and outflows / radio lines: ISM / submillimeter: ISM / ISM: clouds
© ESO, 2012
1. Introduction
Orion BN/KL (Becklin & Neugebauer 1967; Kleinmann & Low 1967), the most luminous source within the Orion molecular cloud 1 (OMC-1), has an infrared (IR) luminosity of ~105 L⊙ and has been intensively observed in numerous molecular lines and also at various wavelengths (O’Dell et al. 2008). Orion BN/KL harbors the eponymous molecular “hot core” (HC) with a rich and complex chemistry (e.g., Blake et al. 1987). In addition, shock and outflow phenomena are also widely present in the Orion BN/KL region. Near-infrared (NIR) observations showed H2 outflows in the form of bullets or fingers (Taylor et al. 1984; Allen & Burton 1993) at a wide angle along a northwest-southeast axis. In radio observations, the powerful outflow was also seen in the high-velocity 12CO line wings (Kwan & Scoville 1976) together with some hydroxyl (OH) masers that trace the shock fronts (Norris 1984; Cohen et al. 2006). Another outflow with lower velocities was detected through proper motions of H2O masers (Genzel et al. 1981; Gaume et al. 1998) accompanied with SiO masers near the IR source IRc2 (Greenhill et al. 1998; Doeleman et al. 1999), and is closely associated with source I (Menten & Reid 1995; Reid et al. 2007).
The origin of the wide-angle high-velocity outflow and northeast-southwest low-velocity outflow has been frequently discussed, and new debates have begun with updated observations. Zapata et al. (2009) reported explosive 12CO bullets in high spatial resolution associated with the H2 fingers, and indicated that this outflow is caused by disintegration of a massive stellar system that happened about 500 years ago. Evidence of a close dynamical interaction of a young stellar system is also supported by the proper motions of the Orion BN source, radio source I, and/or source n, which may be runaway objects from a dynamically decayed multiple system (Nissen et al. 2012; Goddi et al. 2011; Bally et al. 2011; Rodríguez et al. 2005; Gómez et al. 2005). Such an event could also produce the energy needed for driving the large-scale outflows in the Orion BN/KL region (Bally & Zinnecker 2005) and may indeed be responsible for most of the luminosity in the region because, unlike other hot molecular cores, the Orion HC (mm/submm continuum emission peak) does not appear to contain an embedded massive protostellar object capable of producing the necessary energy (Zapata et al. 2011). In this paper, we present the results of the new 12CO J = 6−5 and J = 7−6 observations toward the Orion BN/KL explosive outflow.
2. Observations
The observations were carried out in 2007 November and 2008 July with the 12 meter APEX telescope on Llano de Chajnantor in Chile (Güsten et al. 2006)1, and were part of the large-scale on-the-fly (OTF) mapping in the OMC-1 core region (for more observational details, see Peng et al. 2012). The observations of the 12CO J = 6−5 (691.5 GHz) and J = 7−6 (806.7 GHz) lines were performed with the dual-color heterodyne array CHAMP+ (Kasemann et al. 2006; Güsten et al. 2008), operating 2 × 7 elements simultaneously in the 450 and 350 μm atmospheric windows. The MPIfR Array Correlator Spectrometer (MACS) and the fast Fourier transform spectrometers (FFTS, Klein et al. 2006) were used as backends. Spectral resolutions were ~0.42 km s-1 for the MACS and ~0.05 km s-1 for the FFTS. The angular resolutions of CHAMP+ are at 806.7 GHz and at 691.5 GHz. The maps were centered on the Orion BN source ( ,
,  ). During the observations, position switching to an emission-free reference position at offsets ( − 500′′, 0′′) was used. Mira (o Ceti) was used as a line-pointing source in the 12CO J = 6 − 5 line, and the overall pointing accuracy is estimated to be ≤ 4″. All spectra were converted to the main beam brightness temperature unit,
  (ηMB is 0.47 and 0.45 for 12CO J = 6−5 and J = 7−6, respectively), using a forward efficiency of 0.95 and beam coupling efficiencies as determined toward Jupiter. All data were reduced using the standard procedures in the GILDAS package2.
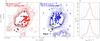 |
Fig. 1 a) Redshifted 12CO J = 6−5 emission (left panel) at the 15 km s-1 channel (ΔV = 1 km s-1) and the blueshifted 12CO emission (right panel) at the 3 km s-1 channel (ΔV = 1 km s-1) overlaid with the SMA 12CO J = 2−1 bullets taken from Zapata et al. (2009). The 12CO J = 6−5 emission is plotted in dark red and dark blue contours running from 8 to 48 K km s-1 in steps of 4 k km s-1 (1σ), and the contours with intensities higher than 48 K km s-1 were skipped for clarity. The redshifted (from +40 to +120 km s-1) and blueshifted (from –30 to –110 km s-1) 12CO J = 2−1 emission peaks at different velocities are plotted as red and blue dots. The squares represent the positions of the outflow explosion center and the H2 emission peak 1 and 2. The triangles represent the positions of the Orion HC (south) and BN (north). The stars mark the positions of the five Trapezium stars (θ1 Ori A, B, C, D, and E). The positions of the H2 emission peak 1 and 2 are marked as squares. Note that the emission in the southwest of the Trapezium stars comes from the OMC-1S region. b) 12CO J = 6−5 (black) and J = 7−6 (red) spectra toward Orion BN (upper panel) and the HC (lower panel). Dashed lines indicate the integrated velocity ranges shown in Figs. 2 and 3. |
3. Results and discussion
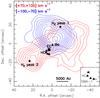 |
Fig. 2 Image of the very high velocity emission in the 12CO J = 7−6 transition (smoothed by a Gaussian profile with a width of |

 |
Fig. 3 a) Very high velocity outflow emission in the 12CO J = 6−5 transition overlaid with the SMA 12CO J = 2−1 emission ( |

In Fig. 1a, the faint high-velocity 12CO J = 6−5 emission around the BN/KL core region shows a clear footprint from the finger-like structure revealed by the SMA 12CO J = 2−1 bullets (Zapata et al. 2009), especially in the northwest (redshifted components) and north (blueshifted components). In addition, Fig. 2 shows the very high velocity (up to ± 100 km s-1) components in the 12CO J = 7−6 emission, and the 12CO outflows are clearly associated with the H2 emission peak 1 and 2, the two strongest peaks of vibrationally excited H2 emission (Sugai et al. 1994; Beckwith et al. 1978). The 12CO J = 7 − 6 and J = 6 − 5 spectra toward the Orion HC and BN are shown in Fig. 1b, where the extended line wings up to ± 100 km s-1 are clearly visible. This very high velocity outflow has been observed in different 12CO transitions before (see, e.g., Wilson et al. 2001; Rodríguez-Franco et al. 1999; Schulz et al. 1995; Schmid-Burgk et al. 1989), and the morphology of the high-velocity 12CO J = 7 − 6 emission is similar to the result obtained by Rodríguez-Franco et al. (1999), where the high-speed blueshifted and redshifted bullets seem to be associated with and preceded by the H2 emission peak 1 and 2, respectively. However, the upper limit of the H2 outflow radial velocity is ~34−40 km s-1 (Nissen et al. 2007), which is only half the velocity of the high-speed 12CO bullets. Another noteworthy similarity between the H2 fingers and 12CO outflows is that the wide-angle distribution in the northwestern part is presented both in the H2 observations and our data.
Orion BN/KL explosive outflow parameters.
The very high velocity 12CO J = 2−1 emission (Fig. 3a) also shows clear emission counterparts in the APEX 12CO J = 6−5 emission, where the redshifted emission lies mostly in the NW-SE direction and the blueshifted one lies mostly in the N-S direction. The average intensities over different position angles (Fig. 3b) also indicate the similarity between SMA 12CO J = 2−1 and APEX J = 6−5 lines. Interestingly, the dense ridge peaking at the Orion HC is located to the east of the explosion center.
The column density of the outflow can be estimated using 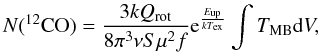 (1)assuming optically thin 12CO J = 6−5 emission at high velocities. The optical depth of 12CO J = 6−5 decreases to about 0.1 at 20 km s-1, estimated from the C18O (6–5)/12CO (6–5) ratios (Peng et al. 2012) with a [12CO]/[C18O] ratio of 490 (Boreiko & Betz 1996; Wilson & Matteucci 1992). Qrot is the rotational partition function, μ the dipole moment of 12CO, S the line strength, and Tex the excitation temperature. The upper level energy Eup/k for 12CO J = 6 − 5 is 116 K. The beam filling factor f was estimated by comparing the outflow sizes (at the contours with 20% of peak intensities) of the 12CO J = 2−1 interferometry data with the APEX 12CO J = 6 − 5 emission sizes, given that these bullets were resolved by the SMA beam (
 ). The excitation temperature Tex of about 60 K was estimated from the ratio between J = 2−1 and J = 6−5 in the LTE condition. The outflow mass and kinetic energy then can be calculated by adopting a [12CO]/[H2] abundance ratio of 8 × 10⁻⁵ in OMC-1 (Wilson & Matteucci 1992). The derived parameters of this outflow are listed in Table 1. The total kinetic energy associated with this explosive outflow in Orion BN/KL is about 1 − 2 × 1047 erg, close to the value derived by Kwan & Scoville (1976) with a revised distance to the Orion Nebula (414 ± 7 pc, Menten et al. 2007). The outflow gas with low velocities (−30 < VLSR < 30 km s-1) is likely contaminated by ambient gas and was excluded from the calculation (the filling factor is also difficult to estimate due to the filtering effect of the SMA data). It is likely that the low-velocity gas only contributes a small fraction of the total outflow mass and kinetic energy. Additionally, the good agreement between the high-resolution low-J12CO observations (Zapata et al. 2009) and our higher-J12CO data indicates a close spatial correlation between the IR H2 fingers and the molecular outflows, which are likely driven by an explosive event instead of the outflows from a single young stellar object or radio source, i.e., SMA-1 or IRc2. Nevertheless, if this explosive outflow is a superposition of several flows emanating from protostellar objects in BN/KL, they are likely distributed uniformly in position angle and will show little asymmetry in redshifted and blueshifted components, which are ruled out by our results.
Zapata et al. (2009, 2011) showed that the 12CO bullets are less present in the southern and southeastern directions (see also Fig. 3b). Because the N-S dense ridge in Orion BN/KL has a velocity gradient where the northern part (with respect to the HC) has a LSR velocity of ≳ 9 km s-1, and ≲ 8 km s-1 for the denser southern part (Peng et al. 2012), it is likely that most of the bullets are decelerated and eventually absorbed in the southern part of the cloud. This scenario is supported by the detection of methanol masers (e.g., the 42,2 − 41,3 E line shown in Fig. 4), which are located mostly in the southern part of the ridge and appear to have formed behind the shock fronts (Johnston et al. 1992). Therefore, it is possible that the shocks due to this explosive outflow are absorbed in the southern part of Orion BN/KL and induce the methanol masers. There may be temperature differences in the cloud that affect the formation and/or distribution of some molecules. This scenario may help to explain the long-debated differentiation between oxygen- and nitrogen-bearing species (see, e.g., Blake et al. 1987; Rodgers & Charnley 2001; Liu et al. 2002; Friedel & Snyder 2008), namely that its main cause may be related to shocks.
Furthermore, if one-forth of the bullets (~2.5 × 1046 erg) are absorbed by the cloud in 500 years, the resulting luminosity (L ~ E/t) is ≳ 400 L⊙, where the time scale for absorption and re-radiation is shorter than 500 years because the ejecta would take time to reach the outer part of the cloud. The total bolometric luminosity for BN/KL is about 7 × 10⁴L⊙ (Gezari et al. 1998) assuming a distance of 414 pc, and therefore the explosive outflow may not be energetic enough to illuminate the whole BN/KL region (other stellar objects may also contribute). However, IRc2 with a luminosity of just 1000 ± 500 L⊙ and the other less luminous infrared sources in BN/KL (Gezari et al. 1998) may be illuminated by this outflow.
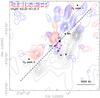 |
Fig. 4 SMA high-velocity 12CO bullets overlaid with the JVLA methanol maser emission (Menten, priv. comm.). The red and blue 12CO emission contours are the same as shown in Figs. 1 and 3. The CH3OH 42,2 − 41,3 E maser emission is shown in gray contours plotted 0.05 to 3.05 Jy beam-1 in step of 0.2 Jy beam-1. The black dashed line indicates the possible symmetric distribution between the 12CO and CH3OH emission, where most of the high-velocity 12CO bullets are likely absorbed below this line. The positions of the explosion center (EC), source BN, HC, and H2 peak 1 and 2 are marked. Magenta triangles represent the positions of source I, SMA-1, source n, and IRc7 (east to west). The three strongest methyl formate emission peaks are marked in black stars (Favre et al. 2011). |
4. Summary
We detected very high velocity (up to ± 100 km s-1) outflows in the 12CO J = 6−5 and J = 7−6 transitions in the Orion BN/KL region. The morphology of our 12CO emission agrees well with the high-resolution SMA observations, where the molecular outflow is driven by an explosive event and is related to the IR H2 fingers seen on a larger scale in Orion BN/KL. The
kinetic energy of this explosive outflow calculated from the high-velocity CO bullets is estimated to be about 1 − 2 × 1047 erg. It is still not clear what caused this explosion, but it is likely related to the runaway objects from a dynamically decayed multiple system in Orion BN/KL. We also proposed a scenario in which the methanol masers are induced by the same outflow at which most of the shocks are decelerated and absorbed in the southern part of BN/KL.
This publication is based on data acquired with the Atacama Pathfinder Experiment (APEX). APEX is a collaboration between the Max-Planck-Institut für Radioastronomie, the European Southern Observatory, and the Onsala Space Observatory.
Acknowledgments
We thank the APEX staff for the support during the observations and the anonymous referee for improving the paper. This work was supported by the International Max Planck Research School (IMPRS) for Astronomy and Astrophysics at the Universities of Bonn and Cologne.
References
- Allen, D. A., & Burton, M. G. 1993, Nature, 363, 54 [NASA ADS] [CrossRef] [Google Scholar]
- Bally, J., & Zinnecker, H. 2005, AJ, 129, 2281 [NASA ADS] [CrossRef] [Google Scholar]
- Bally, J., Cunningham, N. J., Moeckel, N., et al. 2011, ApJ, 727, 113 [NASA ADS] [CrossRef] [Google Scholar]
- Becklin, E. E., & Neugebauer, G. 1967, ApJ, 147, 799 [NASA ADS] [CrossRef] [Google Scholar]
- Beckwith, S., Persson, S. E., Neugebauer, G., & Becklin, E. E. 1978, ApJ, 223, 464 [NASA ADS] [CrossRef] [Google Scholar]
- Boreiko, R. T., & Betz, A. L. 1996, ApJ, 467, L113 [NASA ADS] [CrossRef] [Google Scholar]
- Blake, G. A., Sutton, E. C., Masson, C. R., & Phillips, T. G. 1987, ApJ, 315, 621 [NASA ADS] [CrossRef] [Google Scholar]
- Cohen, R. J., Gasiprong, N., Meaburn, J., & Graham, M. F. 2006, MNRAS, 367, 541 [NASA ADS] [CrossRef] [Google Scholar]
- Doeleman, S. S., Lonsdale, C. J., & Pelkey, S. 1999, ApJ, 510, L55 [NASA ADS] [CrossRef] [Google Scholar]
- Friedel, D. N., & Snyder, L. E. 2008, ApJ, 672, 962 [NASA ADS] [CrossRef] [Google Scholar]
- Favre, C., Despois, D., Brouillet, N., et al. 2011, A&A, 532, A32 [NASA ADS] [CrossRef] [EDP Sciences] [Google Scholar]
- Furuya, R. S., & Shinnaga, H. 2009, ApJ, 703, 1198 [NASA ADS] [CrossRef] [Google Scholar]
- Gaume, R. A., Wilson, T. L., Vrba, F. J., Johnston, K. J., & Schmid-Burgk, J. 1998, ApJ, 493, 940 [NASA ADS] [CrossRef] [Google Scholar]
- Genzel, R., Reid, M. J., Moran, J. M., & Downes, D. 1981, ApJ, 244, 884 [NASA ADS] [CrossRef] [Google Scholar]
- Gezari, D. Y., Backman, D. E., & Werner, M. W. 1998, ApJ, 509, 283 [NASA ADS] [CrossRef] [Google Scholar]
- Greenhill, L. J., Gwinn, C. R., Schwartz, C., Moran, J. M., & Diamond, P. J. 1998, Nature, 396, 650 [NASA ADS] [CrossRef] [PubMed] [Google Scholar]
- Goddi, C., Humphreys, E. M. L., Greenhill, L. J., Chandler, C. J., & Matthews, L. D. 2011, ApJ, 728, 15 [NASA ADS] [CrossRef] [Google Scholar]
- Gómez, L., Rodríguez, L. F., Loinard, L., et al. 2005, ApJ, 635, 1166 [NASA ADS] [CrossRef] [Google Scholar]
- Güsten, R., Booth, R. S., Cesarsky, C., et al. 2006, Proc. SPIE, 6267, 37 [NASA ADS] [Google Scholar]
- Güsten, R., Baryshev, A., Bell, A., et al. 2008, Proc. SPIE, 7020, 25 [Google Scholar]
- Johnston, K. J., Gaume, R., Stolovy, S., et al. 1992, ApJ, 385, 232 [NASA ADS] [CrossRef] [Google Scholar]
- Kasemann, C., Güsten, R., Heyminck, S., et al. 2006, Proc. SPIE, 6275, 9 [Google Scholar]
- Klein, B., Philipp, S. D., Krämer, I., et al. 2006, A&A, 454, L29 [NASA ADS] [CrossRef] [EDP Sciences] [Google Scholar]
- Kleinmann, D. E., & Low, F. J. 1967, ApJ, 149, L1 [NASA ADS] [CrossRef] [Google Scholar]
- Kwan, J., & Scoville, N. 1976, ApJ, 210, L39 [NASA ADS] [CrossRef] [Google Scholar]
- Liu, S.-Y., Girart, J. M., Remijan, A., & Snyder, L. E. 2002, ApJ, 576, 255 [NASA ADS] [CrossRef] [Google Scholar]
- Menten, K. M., & Reid, M. J. 1995, ApJ, 445, L157 [NASA ADS] [CrossRef] [Google Scholar]
- Menten, K. M., Reid, M. J., Forbrich, J., & Brunthaler, A. 2007, A&A, 474, 515 [NASA ADS] [CrossRef] [EDP Sciences] [Google Scholar]
- Nissen, H. D., Gustafsson, M., Lemaire, J. L., et al. 2007, A&A, 466, 949 [NASA ADS] [CrossRef] [EDP Sciences] [Google Scholar]
- Nissen, H. D., Cunningham, N. J., Gustafsson, M., et al. 2012, A&A, 540, A119 [NASA ADS] [CrossRef] [EDP Sciences] [Google Scholar]
- Norris, R. P. 1984, MNRAS, 207, 127 [NASA ADS] [Google Scholar]
- O’Dell, C. R., Muench, A., Smith, N., & Zapata, L. 2008, Handbook of Star Forming Regions, Volume I: The Northern Sky ASP Monograph Publications, ed. B. Reipurth, 4, 544 [Google Scholar]
- Peng, T.-C., Wyrowski, F., Zapata, L. A., Güsten, R., & Menten, K. M. 2012, A&A, 538, A12 [NASA ADS] [CrossRef] [EDP Sciences] [Google Scholar]
- Reid, M. J., Menten, K. M., Greenhill, L. J., & Chandler, C. J. 2007, ApJ, 664, 950 [NASA ADS] [CrossRef] [Google Scholar]
- Rodgers, S. D., & Charnley, S. B. 2001, ApJ, 546, 324 [Google Scholar]
- Rodríguez, L. F., Poveda, A., Lizano, S., & Allen, C. 2005, ApJ, 627, L65 [NASA ADS] [CrossRef] [Google Scholar]
- Rodríguez-Franco, A., Martín-Pintado, J., & Wilson, T. L. 1999, A&A, 344, L57 [NASA ADS] [Google Scholar]
- Schmid-Burgk, J., Densing, R., Krugel, E., et al. 1989, A&A, 215, 150 [NASA ADS] [Google Scholar]
- Schulz, A., Henkel, C., Beckmann, U., et al. 1995, A&A, 295, 183 [NASA ADS] [Google Scholar]
- Sugai, H., Usuda, T., Kataza, H., et al. 1994, ApJ, 420, 746 [NASA ADS] [CrossRef] [Google Scholar]
- Taylor, K. N. R., Storey, J. W. V., Sandell, G., Williams, P. M., & Zealey, W. J. 1984, Nature, 311, 236 [NASA ADS] [CrossRef] [Google Scholar]
- Wilson, T. L., & Matteucci, F. 1992, A&ARv, 4, 1 [NASA ADS] [CrossRef] [Google Scholar]
- Wilson, T. L., Muders, D., Kramer, C., & Henkel, C. 2001, ApJ, 557, 240 [NASA ADS] [CrossRef] [Google Scholar]
- Zapata, L. A., Schmid-Burgk, J., Ho, P. T. P., Rodríguez, L. F., & Menten, K. M. 2009, ApJ, 704, L45 [NASA ADS] [CrossRef] [Google Scholar]
- Zapata, L. A., Schmid-Burgk, J., & Menten, K. M. 2011, A&A, 529, A24 [NASA ADS] [CrossRef] [EDP Sciences] [Google Scholar]
All Tables
All Figures
|
Fig. 1 a) Redshifted 12CO J = 6−5 emission (left panel) at the 15 km s-1 channel (ΔV = 1 km s-1) and the blueshifted 12CO emission (right panel) at the 3 km s-1 channel (ΔV = 1 km s-1) overlaid with the SMA 12CO J = 2−1 bullets taken from Zapata et al. (2009). The 12CO J = 6−5 emission is plotted in dark red and dark blue contours running from 8 to 48 K km s-1 in steps of 4 k km s-1 (1σ), and the contours with intensities higher than 48 K km s-1 were skipped for clarity. The redshifted (from +40 to +120 km s-1) and blueshifted (from –30 to –110 km s-1) 12CO J = 2−1 emission peaks at different velocities are plotted as red and blue dots. The squares represent the positions of the outflow explosion center and the H2 emission peak 1 and 2. The triangles represent the positions of the Orion HC (south) and BN (north). The stars mark the positions of the five Trapezium stars (θ1 Ori A, B, C, D, and E). The positions of the H2 emission peak 1 and 2 are marked as squares. Note that the emission in the southwest of the Trapezium stars comes from the OMC-1S region. b) 12CO J = 6−5 (black) and J = 7−6 (red) spectra toward Orion BN (upper panel) and the HC (lower panel). Dashed lines indicate the integrated velocity ranges shown in Figs. 2 and 3. |
| In the text | |
|
Fig. 2 Image of the very high velocity emission in the 12CO J = 7−6 transition (smoothed by a Gaussian profile with a width of |
| In the text | |
|
Fig. 3 a) Very high velocity outflow emission in the 12CO J = 6−5 transition overlaid with the SMA 12CO J = 2−1 emission ( |
| In the text | |
|
Fig. 4 SMA high-velocity 12CO bullets overlaid with the JVLA methanol maser emission (Menten, priv. comm.). The red and blue 12CO emission contours are the same as shown in Figs. 1 and 3. The CH3OH 42,2 − 41,3 E maser emission is shown in gray contours plotted 0.05 to 3.05 Jy beam-1 in step of 0.2 Jy beam-1. The black dashed line indicates the possible symmetric distribution between the 12CO and CH3OH emission, where most of the high-velocity 12CO bullets are likely absorbed below this line. The positions of the explosion center (EC), source BN, HC, and H2 peak 1 and 2 are marked. Magenta triangles represent the positions of source I, SMA-1, source n, and IRc7 (east to west). The three strongest methyl formate emission peaks are marked in black stars (Favre et al. 2011). |
| In the text | |
Current usage metrics show cumulative count of Article Views (full-text article views including HTML views, PDF and ePub downloads, according to the available data) and Abstracts Views on Vision4Press platform.
Data correspond to usage on the plateform after 2015. The current usage metrics is available 48-96 hours after online publication and is updated daily on week days.
Initial download of the metrics may take a while.