Fig. 3
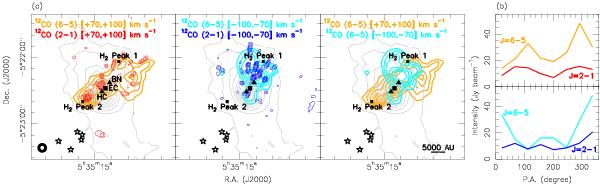
a) Very high velocity outflow emission in the 12CO J = 6−5 transition overlaid with the SMA 12CO J = 2−1 emission ( , PA = –14°, Zapata et al. 2009) and the H2 column density (Peng et al. 2012). The left panel shows the redshifted 12CO emission integrated from +70 to +100 km s-1 (VLSR), and the middle panel shows the blueshifted 12CO emission integrated from −100 to −70 km s-1. The 12CO J = 6−5 emission is plotted in orange and light blue contours running from 10% to 90% in steps of 10% of the peak intensity. The 12CO J = 2−1 emission is plotted in thick red and blue contours from 30% to 90% in steps of 20% of the peak intensity. The H2 column density (derived from CO isotopologs, Peng et al. 2012) is plotted in gray contours running from 10% to 90% in steps of 10% of the peak density (5.8 × 1023 cm-2). The right panel shows the superposition of the high-velocity 12CO emission from the left and middle panels, and the beam sizes of APEX and SMA are indicated in the first panel. The squares represent the positions of the outflow explosion center (EC) and the H2 emission peak 1 and 2. The triangles represent the positions of the Orion HC (south) and BN (north). The stars mark the positions of the five Trapezium stars (θ1 Ori A, B, C, D, and E). b) The corresponding mean intensities (redshifted and blueshifted) are measured in different position angles (in steps of 45°). Note that the SMA 12CO J = 2 − 1 intensities were multiplied by 3.
Current usage metrics show cumulative count of Article Views (full-text article views including HTML views, PDF and ePub downloads, according to the available data) and Abstracts Views on Vision4Press platform.
Data correspond to usage on the plateform after 2015. The current usage metrics is available 48-96 hours after online publication and is updated daily on week days.
Initial download of the metrics may take a while.