Fig. 2
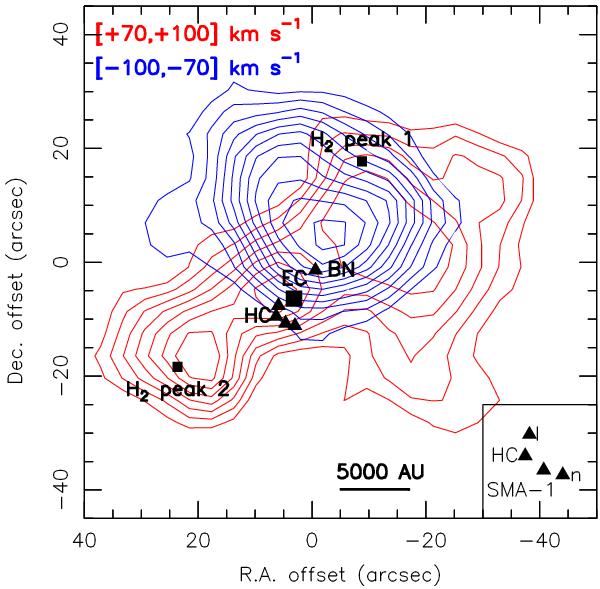
Image of the very high velocity emission in the 12CO J = 7−6 transition (smoothed by a Gaussian profile with a width of  ). Red contours are plotted from 30 to 90 K km s-1 in steps of 10 K km s-1 (2σ level), and blue contours are plotted from 30 to 130 K km s-1 in steps of 10 K km s-1 (2σ level). The positions of source I, the HC, SMA-1, and source n are represented as triangles, and their relative positions are indicated in the bottom-right panel. The squares represent the positions of the outflow explosion center (EC) and the H2 emission peak 1 and 2.
Current usage metrics show cumulative count of Article Views (full-text article views including HTML views, PDF and ePub downloads, according to the available data) and Abstracts Views on Vision4Press platform.
Data correspond to usage on the plateform after 2015. The current usage metrics is available 48-96 hours after online publication and is updated daily on week days.
Initial download of the metrics may take a while.