Fig. 1
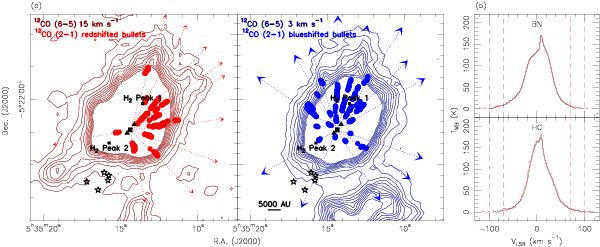
a) Redshifted 12CO J = 6−5 emission (left panel) at the 15 km s-1 channel (ΔV = 1 km s-1) and the blueshifted 12CO emission (right panel) at the 3 km s-1 channel (ΔV = 1 km s-1) overlaid with the SMA 12CO J = 2−1 bullets taken from Zapata et al. (2009). The 12CO J = 6−5 emission is plotted in dark red and dark blue contours running from 8 to 48 K km s-1 in steps of 4 k km s-1 (1σ), and the contours with intensities higher than 48 K km s-1 were skipped for clarity. The redshifted (from +40 to +120 km s-1) and blueshifted (from –30 to –110 km s-1) 12CO J = 2−1 emission peaks at different velocities are plotted as red and blue dots. The squares represent the positions of the outflow explosion center and the H2 emission peak 1 and 2. The triangles represent the positions of the Orion HC (south) and BN (north). The stars mark the positions of the five Trapezium stars (θ1 Ori A, B, C, D, and E). The positions of the H2 emission peak 1 and 2 are marked as squares. Note that the emission in the southwest of the Trapezium stars comes from the OMC-1S region. b) 12CO J = 6−5 (black) and J = 7−6 (red) spectra toward Orion BN (upper panel) and the HC (lower panel). Dashed lines indicate the integrated velocity ranges shown in Figs. 2 and 3.
Current usage metrics show cumulative count of Article Views (full-text article views including HTML views, PDF and ePub downloads, according to the available data) and Abstracts Views on Vision4Press platform.
Data correspond to usage on the plateform after 2015. The current usage metrics is available 48-96 hours after online publication and is updated daily on week days.
Initial download of the metrics may take a while.