Fig. 4
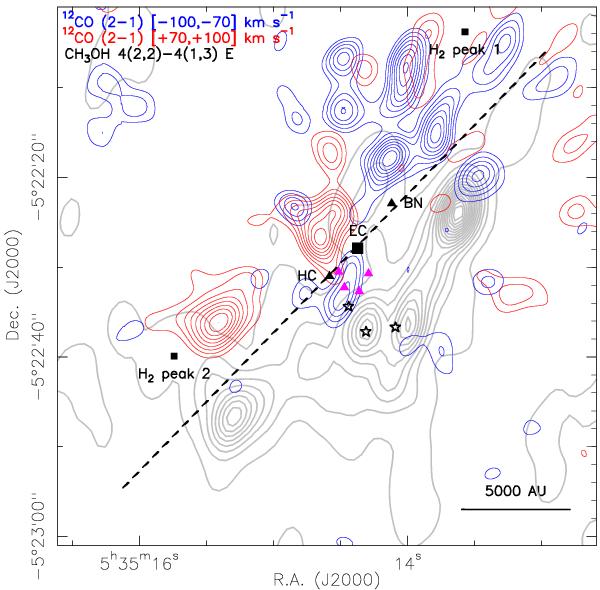
SMA high-velocity 12CO bullets overlaid with the JVLA methanol maser emission (Menten, priv. comm.). The red and blue 12CO emission contours are the same as shown in Figs. 1 and 3. The CH3OH 42,2 − 41,3 E maser emission is shown in gray contours plotted 0.05 to 3.05 Jy beam-1 in step of 0.2 Jy beam-1. The black dashed line indicates the possible symmetric distribution between the 12CO and CH3OH emission, where most of the high-velocity 12CO bullets are likely absorbed below this line. The positions of the explosion center (EC), source BN, HC, and H2 peak 1 and 2 are marked. Magenta triangles represent the positions of source I, SMA-1, source n, and IRc7 (east to west). The three strongest methyl formate emission peaks are marked in black stars (Favre et al. 2011).
Current usage metrics show cumulative count of Article Views (full-text article views including HTML views, PDF and ePub downloads, according to the available data) and Abstracts Views on Vision4Press platform.
Data correspond to usage on the plateform after 2015. The current usage metrics is available 48-96 hours after online publication and is updated daily on week days.
Initial download of the metrics may take a while.