| Issue |
A&A
Volume 543, July 2012
|
|
|---|---|---|
| Article Number | A88 | |
| Number of page(s) | 15 | |
| Section | Interstellar and circumstellar matter | |
| DOI | https://doi.org/10.1051/0004-6361/201219128 | |
| Published online | 04 July 2012 | |
The high-mass disk candidates NGC 7538IRS1 and NGC 7538S⋆
Max-Planck-Institute for Astronomy, Königstuhl 17, 69117 Heidelberg, Germany
e-mail: This email address is being protected from spambots. You need JavaScript enabled to view it.
Received: 28 February 2012
Accepted: 25 April 2012
Abstract
Context. The nature of embedded accretion disks around forming high-mass stars is one of the missing puzzle pieces for a general understanding of the formation of the most massive and luminous stars.
Aims. We want to dissect the small-scale structure of the dust continuum and kinematic gas emission toward two of the most prominent high-mass disk candidates.
Methods. Using the Plateau de Bure Interferometer at ~1.36 mm wavelengths in its most extended configuration we probe the dust and gas emission at ~0.3′′, corresponding to linear resolution elements of ~800 AU.
Results. Even at that high spatial resolution NGC 7538IRS1 remains a single compact and massive gas core with extraordinarily high column densities, corresponding to visual extinctions on the order of 105 mag, and average densities within the central 2000 AU of ~2.1 × 109 cm-3 that have not been measured before. We identify a velocity gradient across in northeast-southwest direction that is consistent with the mid-infrared emission, but we do not find a gradient that corresponds to the proposed CH3OH maser disk. The spectral line data toward NGC 7538IRS1 reveal strong blue- and red-shifted absorption toward the mm continuum peak position. While the blue-shifted absorption is consistent with an outflow along the line of sight, the red-shifted absorption allows us to estimate high infall rates on the order of 10-2 M⊙ yr-1. Although we cannot prove that the gas will be accreted in the end, the data are consistent with ongoing star formation activity in a scaled-up low-mass star formation scenario. Compared to that, NGC 7538S fragments in a hierarchical fashion into several sub-sources. While the kinematics of the main mm peak are dominated by the accompanying jet, we find rotational signatures from a secondary peak. Furthermore, strong spectral line differences exist between the sub-sources which is indicative of different evolutionary stages within the same large-scale gas clump.
Conclusions. NGC 7538IRS1 is one of the most extreme high-mass disk candidates known today. The large concentration of mass into a small area combined with the high infall rates are unusual and likely allow continued accretion. While the absorption is interesting for the infall studies, higher-excited lines that do not suffer from the absorption are needed to better study the disk kinematics. In contrast to that, NGC 7538S appears as a more typical high-mass star formation region that fragments into several sources. Many of them will form low- to intermediate-mass stars. The strongest mm continuum peak is likely capable to form a high-mass star, however, likely of lower mass than NGC 7538IRS1.
Key words: stars: formation / stars: early-type / stars: individual: NGC 7538IRS1 / stars: massive / stars: individual: NGC 7538S
Based on observations carried out with the IRAM Plateau de Bure Interferometer. IRAM is supported by INSU/CNRS (France), MPG (Germany) and IGN (Spain). The data are available in electronic form at the CDS via anonymous ftp to cdsarc.u-strasbg.fr (130.79.128.5) or via http://cdsarc.u-strasbg.fr/viz-bin/qcat?J/A+A/543/A88
© ESO, 2012
1. Introduction
The characterization of accretion disks around young high-mass protostars is one of the main unsolved questions in massive star formation research (e.g., Beuther et al. 2007a, 2009; Cesaroni et al. 2007; Kraus et al. 2010). The controversy arises around the difficulty to accumulate mass onto a massive protostar when it gets larger than 8 M⊙ because the radiation pressure of the growing protostar may be strong enough to revert the gas inflow in spherical accretion scenarios (e.g., Kahn 1974; Wolfire & Cassinelli 1987). Different ways to circumvent this problem are proposed, the main two are (a) scaled-up disk accretion (e.g., Yorke & Sonnhalter 2002; Krumholz et al. 2009; Kuiper et al. 2010) partially requiring initial turbulent gas and dust cores (e.g., McKee & Tan 2003) and including ionization radiation (e.g., Keto 2002) and magnetic fields (e.g., Peters et al. 2011), and (b) competitive accretion and potential (proto)stellar mergers at the dense centers of evolving massive (proto)clusters (e.g., Bonnell et al. 2004, 2007; Bally & Zinnecker 2005).
Over recent years, much indirect evidence has been accumulated that massive accretion disks do exist. The main argument stems from massive molecular outflow observations that identify collimated and energetic outflows from high-mass protostars, resembling the properties of known low-mass star formation sites (e.g., Henning et al. 2000; Beuther et al. 2002; Wu et al. 2004; Zhang et al. 2005; Arce et al. 2007; López-Sepulcre et al. 2009). Such collimated jet-like outflow structures are only explainable with an underlying massive accretion disk driving the outflows via magneto-centrifugal acceleration. From a modeling approach, numeric simulations and analytic calculations of massive collapsing gas cores result in the formation of massive accretion disks as well (Yorke & Sonnhalter 2002; Kratter & Matzner 2006; Krumholz et al. 2009; Kuiper et al. 2010; Peters et al. 2011). Although alternative formation scenarios are proposed, there is a growing consensus in the massive star formation community that accretion disks should also exist in high-mass star formation. However, it is still poorly known whether such massive disks are similar to their low-mass counterparts, hence dominated by the central protostar and in Keplerian rotation, or whether they are perhaps self-gravitating non-Keplerian entities.
While indirect evidence for massive disks is steadily increasing, direct observational studies are largely missing. This discrepancy can mainly be attributed to the clustered mode of massive star formation, the typically large distances and the high extinction. Hence, spatially disentangling such structures is a difficult task. While several disk candidates exist around early B-stars (e.g., Cesaroni et al. 1997, 2005; Schreyer et al. 2002; Shepherd et al. 2001; Zhang et al. 2002; Chini et al. 2004; Kraus et al. 2010; Keto & Zhang 2010; Fallscheer et al. 2011), more massive O-star like systems rather show larger-scale toroid-like structures not consistent with classical Keplerian accretion disks (e.g., Beltrán et al. 2004; Beltrán et al. 2011; Beuther et al. 2005; Beuther & Walsh 2008; Sollins et al. 2005; Keto & Wood 2006; Cesaroni et al. 2007; Fallscheer et al. 2009). However, the non-detection of Keplerian structures around O-stars does not imply that they do not exist, it rather indicates that they are likely on smaller spatial scales hidden by the toroids. Therefore, penetrating more deeply into the central structures at the highest possible spatial resolution is the next step to go.
The high-mass accretion disk candidates NGC 7538IRS1 and NGC 7538S:
The source selection for such a project is driven by the scientific goals and the technical feasibility. The two disk candidates NGC 7538IRS1 and NGC 7538S combine the best of both worlds: On the one hand, they are two already well-studied massive accretion disk candidates in different evolutionary stages at a still modest distance of ~2.7 kpc (e.g., Sandell et al. 2003; Sandell & Wright 2010; Pestalozzi et al. 2004, 2006; Moscadelli et al. 2009; Puga et al. 2010), and they are easily observable in a mosaic mode since their spatial separation is only of order ~80′′. On the other hand, with a RA of 23 h and a Dec of 61 degrees they are ideal Plateau de Bure Interferometer (PdBI) targets to be observed in long tracks resulting in the best achievable synthesized beams. Figure 1 presents a large-scale 1.2 mm continuum map on top of near-infrared K-band data (Sandell & Sievers 2004; Puga et al. 2010; see also Reid & Wilson 2005).
NGC 7538IRS1 has been extensively studied, and the central source is estimated to a mass of ~30 M⊙ and a luminosity of ~8 × 10⁴ L⊙ (e.g., Willner 1976; Campbell & Thompson 1984; Pestalozzi et al. 2004). While Campbell (1984) and Sandell et al. (2009) report an ionized jet in north-south direction, Minier et al. (2000) and Pestalozzi et al. (2004, 2009) present CH3OH maser observations indicative of an accretion disk almost perpendicular to the outflow. Partly different interpretations arise from mid-infrared continuum imaging (De Buizer & Minier 2005): they detected elongated mid-infrared emission in northwest-southeast direction aligned with a bipolar outflow reported in CO by Davis et al. (1998), and even earlier in NH3 by Keto (1991) who also performed radiation transfer calculations for the region. This large-scale mid-infrared emission may stem from the inner walls of the outflow. The jet and outflow emission is interpreted from speckle data as due to a precessing jet (Kraus et al. 2006). On smaller scales, the mid-infrared emission appears elongated almost perpendicular to that outflow axis which De Buizer & Minier (2005) interprete as an inner accretion disk of approximate size of ~900 AU. Klaassen et al. (2009) also identify a velocity gradient in dense gas in northeast-southwest direction. Furthermore, the rare H2CO maser emission from this source (Forster et al. 1985; Pratap et al. 1992; Hoffman et al. 2003) is also consistent with a very young disk candidate. Surcis et al. (2011) present new CH3OH and H2O maser observations, and their data are also consistent with a rotating structure in northeast-southwest direction and an outflow opposite to that. Hutawarakorn & Cohen (2003) show the OH maser emission in this region. Figure 2 sketches the different axis and other features found in the literature. While maser, ionized gas and warm dust are well studied for this source, a good characterization of the dust and thermal gas emission was lacking. Recently, Qiu et al. (2011) observed the region with the Submillimeter Array (SMA) at 3′′ × 2′′ resolution in mm continuum and line emission, and they revealed 9 mm sources within a projected area of 0.35 pc. Compared to the blue-shifted absorption observed by Keto (1991) and Zheng et al. (2001) in the low-excitation NH3 lines that is indicative of outflowing gas motions, Qiu et al. (2011) detected first red-shifted absorption toward the main mm core which they interprete as signature of ongoing infall. Furthermore, the general structure of their proposed multiple outflows is consistent with the northwest-southeast outflow previously reported by, e.g., Keto (1991); Davis et al. (1998); Klaassen et al. (2011). Our data now resolve the region at again an order of magnitude higher spatial resolution, allowing us to study the central core in unprecedented detail.
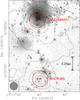 |
Fig. 1 Overview of the NGC 7538 complex. The grey-scale presents the K-band image from Puga et al. (2010), and the contours show the single-dish 1.2 mm continuum data from Sandell & Sievers (2004). The colored stars and circles show the central positions and FWHM of the primary beam of the PdBI at 1.3 mm wavelength for NGC 7538IRS1 and NGC 7538S in the north and south, respectively. The contour levels are from 250 mJy beam-1 to 5.25 Jy beam-1 in steps of 500 mJy beam-1. The beam of the 30 m observations and a scale-bar are shown at the bottom-left and right, respectively. |
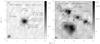 |
Fig. 2 PdBI 1.36 mm continuum images toward NGC 7538IRS1 and NGC 7538S in the left and right panel, respectively. The contour levels start at 4σ values and continue in 8σ and 4σ steps for NGC 7538IRS1 and NGC 7538S (1σ values are 29 mJy beam-1 and 0.7 mJy beam-1, respectively). Several potential disk and outflow axis reported in the literature are presented (Davis et al. 1998; De Buizer & Minier 2005; Sandell et al. 2009; Pestalozzi et al. 2004, 2009; Sandell & Wright 2010, see Introduction for more details). The open stars, square, triangle and six-pointed star mark the positions of the OH, H2O, class ii CH3OH and H2CO masers (Argon et al. 2000; Kameya et al. 1990; Pestalozzi et al. 2006; Hoffman et al. 2003). A scale-bar and the synthesized beam are shown in both panels. The box zooms into the region around mm1 in more detail. The coordinates are relative to the phase centers given in Sect. 2. |
NGC 7538S is supposed to be younger than NGC 7538IRS1 but also hosts CH3OH Class ii, H2O and OH maser emission (Kameya et al. 1990; Argon et al. 2000; Pestalozzi et al. 2006). About ~ 80′′ south of NGC 7538IRS1 (Fig. 1), it roughly coincides with a far-infrared source with luminosity ~1.5 × 10⁴ L⊙ (Werner et al. 1979; Thronson & Harper 1979) corresponding to an early B-star. Recently, Sandell & Wright (2010) and Wright et al. (2012) also report the detection of NGC 7538S in deep mid-infrared IRAC Spitzer observations at wavelengths between 4.5 and 8 μm, as well as a weak cm continuum source likely stemming from a thermal jet. Sandell et al. (2003) resolved a 30 000 AU rotating structure with a bipolar outflow emanating perpendicular to that by means of BIMA interferometric mm observations . Wright et al. (2012) resolved that structure into three separate mm sources. Recent interferometric observations (between ~3′′ and 8′′ resolution) in different molecular line tracers largely confirm this picture (Sandell & Wright 2010). However, their work indicated that many of the molecules are affected by the jet/outflow, and clear rotational signatures were hard to isolate. While the previous data are consistent with a rotating structure, the spatial resolution was not sufficient to analyze the disk candidate in detail. Figure 2 again sketches the main features found in the literature.
The different ages of the two targets make them ideal candidates to investigate also disk evolutionary properties within the same observations.
2. Observations
The two sources were observed in two tracks – A and B configuration on January 26th, 2011, and February 10th, 2011, respectively – in two fields where each field was centered on NGC 7538IRS1 and NGC 7538S (see Fig. 1). The phase centers for the two fields were RA (J2000.) 23h13m45.36s, Dec (J2000.0) 61°28′10.55′′ and RA (J2000.) 23h13m44.86s and Dec (J2000.0) 61° 26′ 48.10′′. Phase calibration was conducted with regularly interleaved observations of the quasars 2146+608, 0059+581 and 0016+731. The bandpass and flux were calibrated with observations of 3C 345, 3C 273 and MWC 349. The absolute flux level is estimated to 20% accuracy.
The continuum emission was extracted from broad band data obtained with the WIDEX correlator with four units and two polarizations covering the frequency range from 217.167 to 220.836 GHz. NGC 7538IRS1 is such an extremely line-rich source that barely any line-free region exists in the spectrum. Therefore, extracting a line-free continuum is difficult, and we produced our continuum map from the whole bandpass. Although there obviously is some line contamination in the final continuum image, the continuum level itself (>1.8 Jy beam-1) is so extraordinarily high that the relative contribution from the lines is negligible. To get a quantitative estimate of the line contamination, we also produced a continuum image from only a very small line-free region (~71 MHz) between the CH3CN lines. The peak flux in this image is only 1.1% below the peak flux in the continuum map produced from the whole bandpass. Obviously the line contamination is negligible and we use the map based on the full bandpass because of the lower rms noise. NGC 7538S is less line-rich, and therefore, we could produce the continuum image from the line-free parts of the spectrum. A comparison of the continuum images for NGC 7538S with and without line contamination shows that they are almost identical. Although NGC 7538IRS1 exhibits more line emission, the previous comparison also indicates that including the lines in the NGC 7538IRS1 continuum bandpath only marginally changes the real fluxes. The full bandpath spectral line data with a chemical analysis will be presented in a forthcoming paper. The 1σ continuum rms for NGC 7538IRS1 and NGC 7538S are 29 mJy beam-1 and 0.7 mJy beam-1. The difference in rms can be explained by the fact that for sparse antenna interferometers like the PdBI, the rms is usually not the thermal rms but it is dominated by the side-lobes of the strongest source in the field. And since NGC 7538IRS1 is far brighter than NGC 7538S, also the rms for NGC 7538I is significantly higher.
Observed spectral lines.
To extract kinematic information, we put several high-spectral resolution units with a nominal resolution of 0.312 MHz or 0.42 km s-1 into the bandpass covering the spectral lines listed in Table 1. The spectral line rms for 0.5 km s-1 wide spectral channels measured in emission-free channels is 8 mJy beam-1 and 7 mJy beam-1 for NGC 7538IRS1 and NGC 7538S, respectively. The vlsr for NGC 7538IRS1 and NGC 7538S are ~−57.3 km s-1 and ~−56.4 km s-1, respectively (Gerner et al., in prep.; van der Tak et al. 2000; Sandell & Wright 2010). The data were inverted with a “robust” weighting scheme and cleaned with the clark algorithm. The synthesized beam of the final continuum and line data is ~0.31′′ × 0.29′′ (PA 110°).
3. Results
3.1. Continuum emission
Zooming in from the large-scale emission (Fig. 1), Fig. 2 presents the small-scale structure of the region in the 1.36 mm continuum emission at a spatial resolution of ~0.3′′ or ~800 AU. While NGC 7538IRS1 remains a single source with peak flux in excess of 1.8 Jy beam-1, NGC 7538S is resolved into several sub-sources labeled mm1 to mm3. NGC 7538S mm1 shows even additional fragmented substructure which we label as mm1a and mm1b. The sub-source mm1a is elongated in approximately the north-south direction, and it is likely that this elongation corresponds to an unresolved substructure again. Comparing the high-resolution mm continuum data with the near-infrared image by Puga et al. (2010), the mm peak in NGC 7538IRS1 is clearly associated with the main infrared source IRS1, whereas the three mm peaks in NGC 7538S have no near-infrared counterpart. However, NGC 7538S mm1 has recently been detected by Spitzer at wavelengths between 4.5 and 8 μm (Sandell & Wright 2010; Wright et al. 2012). It should also be noted that the 8 additional sources reported by Qiu et al. (2011) within an area of 0.35 pc are not detected by our higher-resolution PdBI observations. This differences can be attributed to our smaller primary beam (FWHM of ~22′′) as well as the lower brightness sensitivity one automatically achieves when going to higher spatial resolution (our 3σ continuum rms of 87 mJy beam-1 corresponds to an approximate brightness sensitivity of ~24 K).
Table 2 presents the measured peak and integrated fluxes of the sub-sources shown in Fig. 2. The integrated fluxes are measured within the 4σ contours. The single-dish 1.2 mm MAMBO data shown in Fig. 1 exhibit peak fluxes of 5702 and 2872 mJy beam-1 for NGC 7538IRS1 and NGC 7538S, respectively. Comparing these numbers to the integrated fluxes we measure with the PdBI (Table 2), we find that toward NGC 7538IRS1 only ~48% of the flux is filtered out with the interferometer. Qiu et al. (2011) also measure with the SMA at about an order of magnitude lower spatial resolution (3′′ × 2′′) an integrated flux of 3.6 Jy, only ~20% higher than our fluxes measured with ~0.3′′ resolution. In comparison to that, toward NGC 7538S approximately 90% of the single-dish flux is missing in the PdBI data. This large difference indicates that NGC 7538IRS1 is extremely concentrated toward the central mm continuum peak whereas NGC 7538S exhibits emission on much larger scales. Since NGC 7538IRS1 has significant amounts of free-free emission (e.g., Pratap et al. 1992; Keto et al. 2008; Sandell et al. 2009), we correct the fluxes for that contribution in Table 2. As shown by Keto et al. (2008), several Hii region models can fit the data, and the exact free-free contribution is hard to isolate. Here, we assume ~1000 mJy to be produced by the free-free emission, the rest is attributed to the dust emission. Recently, Wright et al. (2012) report the cm free-free fluxes from NGC 7538S mm1a, and following their approach we correct 8 mJy free-free flux contribution in Table 2 as well.
Millimeter continuum properties.
Assuming optically thin emission from dust following the standard approach by Hildebrand (1983) we can estimate gas masses and column densities at an assumed temperature. Because NGC 7538IRS1 is a strong infrared source and hot core, following Qiu et al. (2011) we assume a dust temperature of 245 K for that source. NGC 7538S is supposedly younger and colder, and we assume a dust temperature of 50 K for the corresponding sub-sources. Regarding the dust properties, we calculate the masses and column densities following Hildebrand (1983, H83) on the one hand, and Ossenkopf & Henning (1994, OH94) for thin ice mantles at densities of 106 cm-3 on the other hand. The gas-to-dust ratio is taken as 186 following Draine et al. (2007) and Jenkins (2004).
Depending on the dust properties, toward NGC 7538S we find core masses between 4 and 38 M⊙ and column densities between 0.7 × 1025 and 1.8 × 1025 cm-2, corresponding to visual extinctions on the order of 104 mag. While such extinctions are very high, similar values have been reported in the past at correspondingly high spatial resolution (e.g., Beuther et al. 2007c; Rodón et al. 2008). One should keep in mind that such high extinction values are only found at the highest spatial resolution achievable with interferometers. At lower resolution, the emission smears out and lower values are found. Regarding the core masses in NGC 7538S, at first sight they do not appear extraordinarily high, however, considering that approximately 90% of the gas are filtered out on larger scales, we only observe the densest structure that is embedded in a much larger gas reservoir.
The situation is considerably different for NGC 7538IRS1 where excessively high column densities on the order of 1026 cm-2 are found (corresponding to visual extinctions above 105 mag), as well as core masses between 43 and 115 M⊙ (depending on the dust properties) within a projected size of ~2000 AU. To the authors’ knowledge this is an extraordinary concentration of mass within small spatial scales and will be discussed in more detail in Sect. 4.1.1.
For comparison, we can also calculate the total gas masses of the two regions based on the single-dish data. As approximate clump sizes, we integrate the flux in the area within the 750 mJy beam contour in Fig. 1. For NGC 7538IRS1 and NGC 7538S, we get integrated 1.2 mm fluxes of 20.9 and 6.2 Jy, respectively. Following the same approach as above, we can calculate the gas masses for the two dust models H83 and OH94. On these large scale we use the temperature estimates from Sandell & Sievers (2004) who estimate 75 and 35 for NGC 7538IRS1 and NGC 7538S. With these numbers we get total gas masses for NGC 7538IRS1 and NGC 7538S of 2512 and 1757 M⊙ (H83) or 1011 and 706 M⊙ (OH94), respectively.
3.2. Spectral line emission
All spectral lines listed in Table 1 were detected toward NGC 7538IRS1 and most of them also toward NGC 7538S. While also velocity gradients are identified in both regions, the detailed spectral line signatures between NGC 7538IRS1 and NGC 7538S are considerably different, in particular we detect strong absorption signatures toward NGC 7538IRS1 but not toward NGC 7538S.
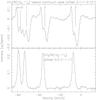 |
Fig. 3 CH3CN(12k − 11k) spectra for k = 0...3 toward the 1.36 mm continuum peak (top panel) and a reference position offset by 0.2′′/ − 1.1′′ from NGC 7538IRS1. The velocity of rest is always marked with a vertical line. |
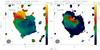 |
Fig. 4 The left and right panels present in color, respectively, the 1st and 2nd moment maps in CH3CN(126 − 116) toward NGC 7538IRS1. The contours show the 1.36 mm continuum emission with the same contour levels as in Fig. 2. A scale-bar and the synthesized beam are presented in each panel. The line in the left panel outlines the axis for the pv-cuts in Figs. 5 and 6. |
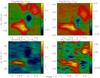 |
Fig. 5 Selected position-velocity diagrams for NGC 7538IRS1 along the axis in Fig. 4. The presented molecules and their transitions are labeled above each panel, the approximate vlsr ≈ − 57.3 km s-1 is marked as well. The black lines in all panels correspond to Keplerian rotation curves around a 30 M⊙ central object. The units of the wedges are Jy beam-1. |
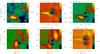 |
Fig. 6 Selected position-velocity diagrams for NGC 7538IRS1 along the axis in Fig. 4. The presented molecules and their transitions are labeled above each panel, the approximate vlsr ≈ − 57.3 km s-1 is marked as well. The units of the wedges are Jy beam-1. |
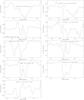 |
Fig. 7 Spectra toward the 1.36 mm continuum peak of NGC 7538IRS1 for selected lines as marked in each panel. The velocity of rest is marked by a line. |
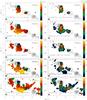 |
Fig. 8 The color scale presents in the left and right panels, the first and second moment maps (intensity weighted peak velocities and line widths) toward NGC 7538S. The molecular lines are marked in each panel. The contours show the 1.36 mm continuum in 4σ steps (1σ ~ 0.7 mJy beam-1). The synthesized beam and a scale-bar are presented in each panel. The lines outline the axis used for the pv-cuts in Figs. 9 and 10. |
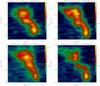 |
Fig. 9 Position velocity cuts through NGC 7538S mm1 in several lines as marked in each panel along the axis shown in Fig. 8, respectively. The vlsr is marked. Offset 0 corresponds to the peak of mm1a. The units of the wedges are Jy beam-1. |
3.2.1. NGC 7538IRS1
Figure 3 presents the CH3CN(12k − 11k) (0 ≤ k ≤ 3) spectra toward the mm continuum peak as well as toward a position approximately 1.1′′ offset south of the continuum peak. While the offset spectrum is a typical CH3CN emission spectrum, the spectrum toward the continuum peak is dominated by absorption features. While absorption features in interferometric data should always be taken with caution because missing flux problems can also artificially produce such features, the fact that we see the absorption only toward the continuum peak but not toward an offset of only ~1.1′′ is a strong indicator for the absorption being a real feature. While Qiu et al. (2011) reported only redshifted absorption in dense gas tracers at a spatial resolution of ~3′′ × 2′′, and Keto (1991) and Zheng et al. (2001) found only blue-shifted absorption in lower-density NH3 lines, Fig. 3 already shows that at the high-spatial resolution of our observations, the dense gas shows blue- and red-shifted components simultaneously.
To identify potential rotational symmetries in these data, Fig. 4 presents the 1st and 2nd moment maps (intensity-weighted peak velocities and line-widths) of our highest excited CH3CN(126 − 116) line (Eu/k = 326 K). Although these moment maps are affected by the absorption close to the continuum peak, both maps clearly identify a velocity gradient in northeast-southwest direction, consistent with the previous lower-resolution Submillimeter Array observations in OCS and SO2 by Klaassen et al. (2009). While the 1st moment map exhibits a blue-red velocity gradient extending about 10 km s-1 which is perpendicular to the northwest-southeast outflow structure reported by Davis et al. (1998) and Qiu et al. (2011), it is interesting that also the line-width map shows a significant line-width increase close to approximately this axis while the line-widths are considerably smaller northwest and southeast of that. The 2nd moment map in Fig. 4 gives visually the impression of a disk-like structure, however, again this needs to be taken with caution because that signature can be affected by the absorption of the gas against the strong continuum.
Figures 5 and 6 now show the position-velocity diagrams along the northeast-southwest cut outlined in Fig. 4. The typical hot molecular core and high-density gas tracers CH3CN and HCOOCH3 exhibit absorption signatures that are dominated by a red-shifted component but show some blue-shifted absorption as well. This signature appears rather independent of the excitation temperature because the shown k = 2 and k = 6 CH3CN(12k − 11k) components cover a range in excitation temperatures Eu/k of 250 K (see Table 1). As expected, the more optically thin isotopologues CH CN does not exhibit such absorption features. While the red-shifted emission part of these spectra is consistent with a typical Keplerian rotation structure, the blue-shifted part of the emission spectrum does not show such a signature. Figure 5 also presents a Keplerian curve for a 30 M⊙ central object (see Sect. 1), again showing the reasonable agreement on the red part of the spectrum but not on the blue side. It is also interesting to note that the higher excited CH3CN(126−116) shows on average a better agreement with the Keplerian curve than the lower excited CH3CN(122−112) line. This is likely due to the fact that the higher excited line traces gas closer to the star which hence exhibits higher velocities. In contrast to that, one can also argue that the non-correspondence of the blue part of the spectrum with Keplerian rotation is not much of a surprise because Keplerian rotation implies that the whole structure is dominated by the central object. This is clearly not the case considering that the central star should have a mass of ~30 M⊙ (see Introduction) and the gas mass of the central structure traced by the mm continuum emission is of that order or even higher as well (Table 2).
The position-velocity diagrams presented in Fig. 6 show slightly different absorption signatures. While almost all of them show red-shifted absorption as well (except CH2CO), the blue-shifted absorption is at least as strong as that, if not stronger. From a blue-shifted perspective, the lowest-excited H2CO line shows a particularly interesting feature because in addition to the blue-shifted component at around − 59 km s-1, it exhibits another blue-shifted component at even more negative velocities around − 65 km s-1. A similar feature was recently also reported in the 1 and 2 cm H2CO lines (AAS poster by Yuan et al. 2011).
A different way to investigate the various absorption features is presented in Fig. 7 where we show the spectra of the various lines extracted directly toward the mm continuum peak position. The absorption features discussed in the paragraphs above are exactly recovered there. Many of the spectra clearly show a double-dibbed signature red- and blue-shifted around the vlsr. To check whether the additional higher-velocity absorption component in the H2CO line is real absorption against the continuum or rather due to missing flux on larger scales, similarly as shown for CH3CN in Fig. 3, we also extracted the H2CO spectrum toward the position 0.2′′/ − 1.1′′ to the south. And like for CH3CN, the H2CO spectrum exhibits a pure and “normal” emission spectrum at that position. This implies that the additional absorption at ~−65 km s-1 should be real. Implications of the observed red- and blue-shifted absorption toward NGC 7538IRS1 will be discussed in Sect. 4.2.1.
3.2.2. NGC 7538S
Toward the second region NGC 7538S we clearly detect all CH3CN lines, as well as the spectral lines from OCS, HC3N, H2CO and CH3OH. In contrast to that, HCOOCH3, NH2CHO and CH2CO are barely detected. There is only a tentative detection of the latter two molecules toward mm2. Regarding the clearly detected molecules and spectral lines, it is interesting that all of them are detected toward the two mm sub-peaks mm1 and mm2 but none of them toward the third mm peak mm3. This already indicates peculiar chemical and evolutionary differences between mm1 and mm2 on the one side and mm3 on the other side. Furthermore, within mm1 we always detect mm1a in the spectral line emission but no molecular line is found toward mm1b. A detailed spectral and chemical analysis of all the other broadband line data we observed simultaneously will be presented in a forthcoming paper. Here we concentrate on the kinematics of the mm peaks mm1 and mm2.
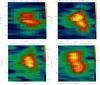 |
Fig. 10 Position velocity cuts through NGC 7538S mm2 in several lines as marked in each panel along the axis shown in Fig. 8, respectively. The vlsr is marked. The full and dotted lines in the OCS panel correspond to Keplerian rotation curves around a 1 and 10 M⊙ star, respectively. The units of the wedges are Jy beam-1. |
Figure 8 presents the 1st and 2nd moment maps (intensity weighted peak velocities and line widths) of respective lines toward that region. While the lower excited lines like H2CO(32,2 − 22,1) or CH3OH(42,2 − 31,2) show also a bit more extended emission, molecular emission from high-density tracers like CH3CN or HC3N are largely confined to mm1, mm2 and their close environment. While there is no obvious velocity difference between mm1 and mm2, toward both sub-peaks we detect in all lines velocity gradients across the mm continuum peaks, for mm1 almost north-south and for mm2 in northeast-southwest direction. Toward mm1 it is interesting to note that the molecular emission to the north is confined almost to the same region as the mm continuum emission whereas the molecular line data extend significantly outside the southern 4σ contours of the mm continuum emission. Since the main mm1a peak is close to the northern edge of that structure, the velocity structure of the gas is rather asymmetric with respect to that peak. The most blue-shifted gas almost peaks toward mm1a and the further one goes south, the more redshifted the gas gets. For the higher density lines of CH3CN(12k − 11k), OCS(18–17) and HC3N(24–23), the line-width or 2nd moment peak is also not exactly toward the main mm continuum peak but a little bit to the south, almost at the tip of the central, north-south elongated mm continuum contour. As discussed in Sect. 3.1, we cannot properly resolve a secondary component there, nevertheless, it appears likely that this slightly elongated structure will resolve into a binary system at even higher spatial resolution.
Figure 9 presents position velocity cuts of selected lines along the axis marked for mm1 in Fig. 8. While the emission appears relatively symmetric around the vlsr, as already mentioned above, the velocity is not symmetric around the main mm peak mm1a which is put at offset 0. Even if one shifts the center by ~0.25′′ south toward the peak of the 2nd moment maps, it still does not appear as a symmetric position velocity cut. The data clearly confirm that the most blue-shifted gas is centered on mm1a and the red-shifted emission continuously moves to the south. Furthermore, the pv-diagrams do not exhibit any signature of Keplerian rotation. These signatures indicate that the observed velocity structure from mm1 unlikely stems from rotation. Since the jet axis is aligned approximately in northwest-southeast direction (Fig. 2), not much offset from the main velocity gradient observed here, it may well be that the velocity gradient is strongly influenced by the central jet and outflow.
In comparison to mm1, Fig. 10 shows the position-velocity cuts through mm2 along the axis shown in Fig. 8. Since mm2 is much smaller in spatial extend and only barely resolved by our observations, the pv-diagrams also exhibit less prominent signatures of velocity gradients. Nevertheless, a velocity gradient is identifiable, most prominently in the OCS(18–17) line. While the structure is too small for a more detailed analysis, it is interesting to note that the OCS(18–17) data are at least consistent with Keplerian rotation around a ~1 M⊙ central object, whereas the expected rotation curve of a more massive object represents the data significantly worse. While one should not take these masses at face-value, they nevertheless indicate that the central mass in NGC 7538S mm2 is significantly lower than that in NGC 7538IRS1.
A different way to investigate the spectral structure of the two sources is again via directly looking at the spectra toward the peak positions (Figs. 11 and 12). While the spectra toward mm2 exhibit more or less Gaussian shapes around the vlsr, this is not the case for the spectra extracted toward mm1a. The mm1a spectra are strongly dominated by the blue-shifted gas which was already identified in pv-diagrams, but we see an additional red-shifted component that is separated by a little flux-depression (not absorption) around the vlsr. This will be discussed in more detail in Sect. 4.2.2.
4. Discussion
4.1. Continuum structure
4.1.1. NGC 7538IRS1
While fragmented sub-sources like those in NGC 7538S have been observed regularly with interferometers toward high-mass star-forming regions (e.g., Beuther et al. 2007b; Zhang et al. 2009), the very massive, centrally condensed and unresolved source NGC 7538IRS1 is peculiar and less typical (e.g., Bontemps et al. 2010). In particular, the fact that one observes a near-infrared source toward that position but at the same time has column densities in excess of 1026 cm-2 (corresponding to visual extinctions in excess of 105 mag) is surprising. This seems to indicate that the outflow/jet from the source must be very close to the line of sight allowing the infrared radiation to escape through the outflow cavity. This is reminiscent to similar sources like W3IRS5 or G9.62+0.19 where also the infrared sources are detected in spite of high column densities because of the alignment of the outflow close to the line of sight (e.g., Rodón et al. 2008; Hofner et al. 2001; Linz et al. 2005).
Furthermore, it is astonishing how much mass is concentrated in a very small area in NGC 7538IRS1. Table 2 and Fig. 2 show that at least more than 40 and potentially even more than 100 M⊙ are concentrated within a source with projected diameter of approximately 2000 AU. To the authors knowledge, there is no other region known with so much mass in such a small area. Assuming 50 M⊙ within a sphere of diameter of ~ 2000 AU, this corresponds to a mean H2 density of ~2.1 × 109 cm-3 which is also high compared to other star-forming regions. It is also about 2 orders of magnitude larger than the average densities derived by Qiu et al. (2011). This difference can largely be attributed to the much smaller size of the core in the PdBI data (a factor 3 in radius) as well as different assumptions in the mass calculations (we adopted a slightly different free-free contribution and gas-to-dust ratio).
Puga et al. (2010) report an age spread between 0.5 and 2.2 Myr for the surrounding infrared cluster whereas the various signatures of ongoing star formation toward the central mm and infrared source (e.g., maser emission, outflows) indicate that the central and most massive object is still in an active star formation process. It appears that in that region the most massive star forms last compared to the lower-mass population, similar to other studies like, e.g., Kumar et al. (2006) or Wang et al. (2011). Furthermore, the strong concentration of mass within a single object without much further fragmentation (except those on larger scales as reported by Qiu et al. 2011; see also Bontemps et al. 2010) is consistent with a scaled-up low-mass star formation scenario for the formation of high-mass stars (e.g., McKee & Tan 2002, 2003; Krumholz et al. 2007, 2009; Kuiper et al. 2010).
4.1.2. NGC 7538S
The substructure one finds in NGC 7538S is indicative of hierarchical fragmentation on different scales. While the single-dish mm continuum data show only one large-scale gas clump with a projected diameter of ~0.5 pc (e.g., Fig. 1, Sandell & Sievers 2004; Reid & Wilson 2005), first interferometric observations already revealed an elongated gas clump with an extend of ~30 000 AU ~ 0.15 pc that showed velocity signatures indicating rotation. Recently, Wright et al. (2012) resolved that elongated structure into three mm continuum sources which we confirm here at even higher spatial resolution. Our new data now also indicate that mm1 splits up likely in ≥ 3 sources forming a trapezium-like system (e.g., Ambartsumian 1955; Megeath et al. 2005; Rodón et al. 2008). The hierarchical fragmentation observed in NGC 7538S resembles the structures recently discussed by Zhang et al. (2009) and Wang et al. (2011) for the infrared dark cloud G28.34, although on projected smaller spatial scales in NGC 7538S.
Following the simple toy-model outlined in Beuther et al. (2012), in a cluster-forming scenario with a typical Kroupa (2001) initial mass function and a star formation efficiency of ~30%, one needs approximately a 1000 M⊙ initial gas clump to form a cluster with at least one 20 M⊙ high-mass stars. As estimated in Sect. 3.1, NGC 7538S fulfills that criterium (and NGC 7538IRS1 even more), and while mm2 supposedly does not form a high-mass star but rather a low- to intermediate-mass object (see Sect. 3.2.2), the higher gas mass (Table 2) and the other high-mass star formation indicators discussed in the introduction and outlined in Fig. 2 indicate that mm1 likely forms a high-mass star within this still very young cluster-forming region.
4.2. Kinematics
4.2.1. NGC 7538IRS1
The exceptional red- and blue-shifted absorption features presented in Sect. 3.2.1 give various insights into the physical processes around that source. As discussed in Sect. 4.1.1, the jet/outflow from this source has to be oriented approximately along the line of sight. Therefore, blue-shifted absorption features against the continuum peak position should be associated with expanding motions from the jet/outflow. Also the fact that we observe in the line with the lowest excitation temperature (H2CO(30,3 − 20,1) with Eu/k ~ 21 K, see also Table 1) an additional absorption feature at even more blue-shifted velocities is consistent with this picture. The lower-excited line traces colder gas further away from the source, and many outflows are known to exhibit Hubble-like velocity structure where the velocity increases with distance from the source (e.g., Arce et al. 2007). Hence colder gas further outside should show absorption at velocities further blue-shifted than closer to the source.
In contrast to that, the red-shifted absorption is indicative of infalling gas. Following the approach outlined in Qiu et al. (2011), assuming a spherical infall geometry one can estimate mass infall rates1 according to Ṁin = 4πr2ρvin where Ṁin and vin are the infall rate and infall velocity, and r and ρ the core radius and density. The latter two values are ~ 1000 AU and ~2.1 × 109 cm-3, respectively (see Sect. 4.1.1). As infall velocity we use 2.3 km s-1 which corresponds to the difference between the peak of the red-shifted absorption at ~−55 km s-1 and the vlsr at around ~−57.3 km s-1 (Gerner et al. in prep; van der Tak et al. 2000).
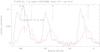 |
Fig. 11 CH3CN(12k − 11k) spectra (0 ≤ k ≤ 3) toward NGC 7538S mm1a (black) and mm2 (red). |
With these numbers, we derive an infall rate estimate of Ṁin ~ 7 × 10⁻² M⊙ yr-1. This is approximately a factor 20 larger than the rate estimated by Qiu et al. (2011). This difference is due to the higher spatial resolution of our data where we resolve the core on smaller scales (radius of 1000 AU here compared to 3000 AU in Qiu et al. 2011) which additionally results in higher average densities of the central core (see Sect. 4.1.1). Considering that the accretion does not occur in a spherical mode over 4π but rather along a flattened disk structure with a solid angle of Ω, the actual disk infall rates Ṁdisk,in should scale like  . Based on the simulations by Kuiper et al. (2012) and Kuiper (priv. comm.), such outflow covers approximately 120 degree opening angle and the disk 60 degree (to be doubled for the north-south symmetry). Since the opening angle does not scale linearly with the surface element, full integration results in ~ 50% or ~ 2π of the sphere being covered by the disk. This results in disk infall rates of Ṁdisk,in ~ 3.5 × 10⁻² M⊙ yr-1, still very high and in the regime of accretion rates required to form high-mass stars (e.g., Wolfire & Cassinelli 1987; McKee & Tan 2003). Although we cannot prove that the gas falls in that far that it can be accreted onto the star (and does not get reverted by the innermost radiation and outflow pressure), such high infall rates should be a pre-requisite to allow accretion even when the central high-mass star has ignited already (e.g., Keto 2003; Kuiper et al. 2010, 2011).
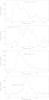 |
Fig. 12 CH3CN(125 − 115) and HC3N(24 − 23) spectra toward NGC 7538S mm1a and mm2. |
An additional caveat arises from the potential contribution of the accretion luminosity to the total luminosity of the region. If one used the infall rates as actual accretion rates Ṁacc and estimated the accretion luminosity Lacc via the classical  (with G the gravitational constant, M ∗ and R ∗ the estimated stellar mass of 30 M⊙ and a stellar radius following Hosokawa & Omukai 2009), one would derive unreasonably high accretion luminosities in excess of the measured luminosity. Therefore, some parameters in this equation have to be different. Most likely this is the accretion rate because not all gas will fall on the star but a large fraction will likely be expelled again by the energetic outflow. Estimating that ratio is out of the scope of this paper. Nevertheless, the data indicate that a significant fraction of the measured luminosity may still stem from the accretion processes.
As outlined in the introduction, the disk orientation in this region has been subject to intense discussion. Although the 1st moment map of NGC 7538IRS1 is distorted from the absorption toward the peak, our data clearly support the orientation of the disk along a northeast-southwest orientation that was also proposed by De Buizer & Minier (2005), Klaassen et al. (2009) or Surcis et al. (2011). We do not find signatures of rotational motion along the more east-west oriented structure that was proposed as a disk from CH3OH maser observations (Pestalozzi et al. 2004, 2009). However, we cannot exclude that the dense gas northeast-southwest oriented emission and the east-west CH3OH masers belong to the same torus-disk structure as suggested by Surcis et al. (2011).
4.2.2. NGC 7538S
The spectral line signatures in NGC 7538S vary considerably among the three main sub-sources. While mm1 and mm2 are strong line emitters, mm3 shows no line emission in any of the discussed lines of this project. Contrary to that discrepancy, the continuum emission from mm2 and mm3 is very similar in size, column density and mass. Therefore, it is most likely that the spectral line differences are real chemical differences among the two sub-sources mm2 and mm3. It is tempting to interprete that these differences are due to different evolutionary stages. While mm2 shows also rotational signatures and is already a star-forming core, mm3 may well still be in a younger and starless phase. In this picture, sources that are separated by less than 10 000 AU and that are embedded within the same large-scale gas clump may not evolve coeval at all. What are the physical reasons for this evolutionary differences? Unfortunately, our data do not allow us to draw conclusions on that point.
The additional blue-redshifted gas components visible in the spectra toward mm1a (Figs. 11 and 12) indicate that while the pv-diagrams (Fig. 9) are dominated by the larger structure encompassing also the dust elongation toward the south, there exist additional velocity structure toward the peak mm1a. Although we do not spatially resolve that substructure, it may well stem from a smaller embedded disk centered on mm1a which is also the likely driving source of the jet in that region (Fig. 2). Since the continuum source mm1 is already resolved in at least two sub-sources (mm1a and mm1b), and mm1a is elongated indicating the existence of an additional source, it is likely that mm1 hosts a multiple system where large-scale kinematic structures are present (best visible in the pv-diagram in Fig. 9) as well as potential small-scale rotational structure around individual sub-sources only identified in the spectra (Figs. 11 and 12). Comparing the larger almost north-south velocity gradient in mm1 with the orientation of the jet in approximately northwest-southeast direction, it appears that the dense gas kinematics in mm1 are strongly influenced by the jet. This makes the identification of rotational signatures even harder. It is likely that higher spatial resolution as well as spectral lines sensitive only to the innermost region around the central protostar are needed to disentangle the rotational structure around mm1a from the kinematic signatures caused by the jet.
Going to larger spatial scales, Sandell et al. (2003) already identified a velocity gradient across the whole 30 000 AU structure that encompass the three regions mm1 to mm3 approximately along the connecting axis of the sub-sources. Interestingly, Sandell et al. (2003) find that the large-scale rotation is consistent with Keplerian motion. Since the kinematics around mm1 appear to be dominated by the jet, Keplerian signatures cannot be expected for that subregion. The situation is less obvious for mm2 (Fig. 10) where the velocity structure at least does not disagree with Keplerian rotation. Regarding the alignment of axis, the proposed rotational axis of the large-scale toroid (Sandell et al. 2003) and the structure around mm2 are approximately aligned whereas the jet-axis dominating mm1 is almost perpendicular to that. Unfortunately, such low-number statistics do not allow us to derive further conclusions from that.
5. Conclusions
Very-high-resolution mm continuum and spectral line observations of the two high-mass disk candidates NGC 7538IRS1 and NGC 7538S reveal intriguing information about the small-scale morphology and kinematics of these two regions.
NGC 7538S appears as a relatively typical source that fragments down to the smallest resolvable scales. The large-scale single-dish gas clump forms an elongated torus of ~ 30 000 AU (Sandell et al. 2003) that fragments into three cores with separations on the order of 5000 AU. At even higher spatial resolution, these cores show additional substructure and the most massive one fragments even further. These data are consistent with hierarchical fragmentation. While the kinematics of the main mm peak mm1 appears to be strongly influenced by the jet/outflow emanating from the source, a spectrum extracted toward the central peak mm1a is indicative of additional unresolved rotational motions. Higher-resolution data are needed to resolve that. The spectral lines toward mm2 also exhibit a velocity gradient, and although barely resolved, the data are consistent with Keplerian rotation around a low- to intermediate-mass object. Therefore, in NGC 7538S we are witnessing the formation of a very young cluster where the sources within mm1 have the potential to form a high-mass star at the end of the evolution. An additional interesting feature is that mm1 and mm2 are strong spectral line emitters whereas mm3 is not. While mm2 and mm3 appear very similar in the continuum emission, the strong diversity in the spectral lines indicate different evolutionary stages. Hence, even within areas of ~ 10 000 AU diameter, we find cores that are likely not evolving coeval. Determining physical reasons for such discrepancies is beyond the scope of this paper.
NGC 7538IRS1 remains a single source even at ~ 800 AU spatial resolution (~0.3′′). This is even more surprising considering that the source is embedded in an already existing near-infrared cluster. NGC 7538IRS1 has extremely large gas and dust column densities corresponding to visual extinction values on the order of ~ 105 mag. The fact that we still see the central source in the infrared implies that the jet/outflow from that region should be aligned closely to the line of sight allowing us to glimpse through the outflow cavity close onto the central source. The central 2000 AU around the source contain a large gas mass on the order of 50 M⊙, implying central average densities in the regime of 109 cm-3.
Since the position-velocity diagrams of NGC 7538IRS1 are distorted by the absorption, interpretation of kinematic signatures are more difficult. Nevertheless, we clearly identify a velocity gradient in northeast-southwestern direction, consistent with the proposed mid-infrared disk emission orientation (De Buizer & Minier 2005) and perpendicular to the outflow axis. Our data do not support the proposed rotational axis based on CH3OH maser emission (Pestalozzi et al. 2004, 2009) that is inclined to our observed axis by approximately 60 deg.
At ~ 0.3′′ spatial resolution, almost all observed spectral lines reveal strong absorption signatures toward the peak of the mm continuum emission (that coincides within the errors with IRS1) in NGC 7538IRS1. While some lines, in particular the lower excitation temperature lines like those of H2CO appear to be dominated by blue-shifted absorption indicative of outflowing gas, the higher-excitation and higher-density lines exhibit clear red-shifted absorption that has to be due to infalling gas. Since the jet/outflow is supposed to be aligned along the line-of-sight, it is no surprise that infalling and outflowing gas are observed at the same spatial position. Estimated mass infall rates are very high, on the order of 10-2 M⊙ yr-1. Although we cannot proof that the gas will continue to be accreted by the central star, nevertheless, the conditions are sufficient to allow accretion still during that already luminous and active phase of the protostellar evolution. Combining the large infall rates with the fact of barely any fragmentation of the gas and dust core, these data are consistent with high-mass star formation proceeding in a scaled-up version of low-mass star formation.
While the presented data already reveal many new insights for both regions, significant information is still missing. In particular, the proposed accretion disk signatures for both sources – NGC 7538IRS1 and NGC 7538S mm1 – are “contaminated” by absorption and jet signatures, respectively. To overcome these issues, one likely needs to resort to even higher excited lines that are neither absorbed by the envelope nor emitted by the outflowing gas.
Since one does not know whether the gas gets actually accreted or not, we prefer the term “infall rate” rather than “accretion rate”.
Acknowledgments
We like to thank the IRAM staff, in particular Jan Martin Winters, for all support during the observation and data reduction process. Thanks a lot also to Goeran Sandell for providing the large-scale 1.2 mm continuum map presented in Fig. 1. Furthermore, we thank the referee Eric Keto for his positive and constructive report on the paper.
References
- Ambartsumian, V. A. 1955, The Observatory, 75, 72 [NASA ADS] [Google Scholar]
- Arce, H. G., Shepherd, D., Gueth, F., et al. 2007, in Protostars and Planets V, eds. B. Reipurth, D. Jewitt, & K. Keil, 245 [Google Scholar]
- Argon, A. L., Reid, M. J., & Menten, K. M. 2000, ApJS, 129, 159 [NASA ADS] [CrossRef] [Google Scholar]
- Bally, J., & Zinnecker, H. 2005, AJ, 129, 2281 [NASA ADS] [CrossRef] [Google Scholar]
- Beltrán, M. T., Cesaroni, R., Neri, R., et al. 2004, ApJ, 601, L187 [NASA ADS] [CrossRef] [Google Scholar]
- Beltrán, M. T., Cesaroni, R., Neri, R., & Codella, C. 2011, A&A, 525, A151 [NASA ADS] [CrossRef] [EDP Sciences] [Google Scholar]
- Beuther, H., & Walsh, A. J. 2008, ApJ, 673, L55 [NASA ADS] [CrossRef] [Google Scholar]
- Beuther, H., Schilke, P., Gueth, F., et al. 2002, A&A, 387, 931 [NASA ADS] [CrossRef] [EDP Sciences] [Google Scholar]
- Beuther, H., Zhang, Q., Sridharan, T. K., & Chen, Y. 2005, ApJ, 628, 800 [NASA ADS] [CrossRef] [Google Scholar]
- Beuther, H., Churchwell, E. B., McKee, C. F., & Tan, J. C. 2007a, in Protostars and Planets V, eds. B. Reipurth, D. Jewitt, & K. Keil, 165 [Google Scholar]
- Beuther, H., Leurini, S., Schilke, P., et al. 2007b, A&A, 466, 1065 [NASA ADS] [CrossRef] [EDP Sciences] [Google Scholar]
- Beuther, H., Zhang, Q., Bergin, E. A., et al. 2007c, A&A, 468, 1045 [NASA ADS] [CrossRef] [EDP Sciences] [Google Scholar]
- Beuther, H., Walsh, A. J., & Longmore, S. N. 2009, ApJS, 184, 366 [NASA ADS] [CrossRef] [Google Scholar]
- Beuther, H., Tackenberg, J., Linz, H., et al. 2012, A&A, 538, A11 [NASA ADS] [CrossRef] [EDP Sciences] [Google Scholar]
- Bonnell, I. A., Vine, S. G., & Bate, M. R. 2004, MNRAS, 349, 735 [NASA ADS] [CrossRef] [Google Scholar]
- Bonnell, I. A., Larson, R. B., & Zinnecker, H. 2007, in Protostars and Planets V, eds. B. Reipurth, D. Jewitt, & K. Keil, 149 [Google Scholar]
- Bontemps, S., Motte, F., Csengeri, T., & Schneider, N. 2010, A&A, 524, A18 [NASA ADS] [CrossRef] [EDP Sciences] [Google Scholar]
- Campbell, B. 1984, ApJ, 282, L27 [NASA ADS] [CrossRef] [Google Scholar]
- Campbell, B., & Thompson, R. I. 1984, ApJ, 279, 650 [NASA ADS] [CrossRef] [Google Scholar]
- Cesaroni, R., Felli, M., Testi, L., Walmsley, C. M., & Olmi, L. 1997, A&A, 325, 725 [NASA ADS] [Google Scholar]
- Cesaroni, R., Neri, R., Olmi, L., et al. 2005, A&A, 434, 1039 [NASA ADS] [CrossRef] [EDP Sciences] [Google Scholar]
- Cesaroni, R., Galli, D., Lodato, G., Walmsley, C. M., & Zhang, Q. 2007, in Protostars and Planets V, eds. B. Reipurth, D. Jewitt, & K. Keil, 197 [Google Scholar]
- Chini, R., Hoffmeister, V., Kimeswenger, S., et al. 2004, Nature, 429, 155 [NASA ADS] [CrossRef] [PubMed] [Google Scholar]
- Davis, C. J., Moriarty-Schieven, G., Eislöffel, J., Hoare, M. G., & Ray, T. P. 1998, AJ, 115, 1118 [NASA ADS] [CrossRef] [Google Scholar]
- De Buizer, J. M., & Minier, V. 2005, ApJ, 628, L151 [NASA ADS] [CrossRef] [Google Scholar]
- Draine, B. T., Dale, D. A., Bendo, G., et al. 2007, ApJ, 663, 866 [NASA ADS] [CrossRef] [Google Scholar]
- Fallscheer, C., Beuther, H., Zhang, Q., Keto, E., & Sridharan, T. K. 2009, A&A, 504, 127 [NASA ADS] [CrossRef] [EDP Sciences] [Google Scholar]
- Fallscheer, C., Beuther, H., Sauter, J., Wolf, S., & Zhang, Q. 2011, ApJ, 729, 66 [NASA ADS] [CrossRef] [Google Scholar]
- Forster, J. R., Goss, W. M., Gardner, F. F., & Stewart, R. T. 1985, MNRAS, 216, 35 [NASA ADS] [Google Scholar]
- Henning, T., Schreyer, K., Launhardt, R., & Burkert, A. 2000, A&A, 353, 211 [NASA ADS] [Google Scholar]
- Hildebrand, R. H. 1983, QJRAS, 24, 267 [NASA ADS] [Google Scholar]
- Hoffman, I. M., Goss, W. M., Palmer, P., & Richards, A. M. S. 2003, ApJ, 598, 1061 [NASA ADS] [CrossRef] [Google Scholar]
- Hofner, P., Wiesemeyer, H., & Henning, T. 2001, ApJ, 549, 425 [NASA ADS] [CrossRef] [Google Scholar]
- Hosokawa, T., & Omukai, K. 2009, ApJ, 691, 823 [NASA ADS] [CrossRef] [Google Scholar]
- Hutawarakorn, B., & Cohen, R. J. 2003, MNRAS, 345, 175 [NASA ADS] [CrossRef] [Google Scholar]
- Jenkins, E. B. 2004, in Origin and Evolution of the Elements, eds. A. McWilliam, & M. Rauch, 336 [Google Scholar]
- Kahn, F. D. 1974, A&A, 37, 149 [NASA ADS] [Google Scholar]
- Kameya, O., Morita, K.-I., Kawabe, R., & Ishiguro, M. 1990, ApJ, 355, 562 [NASA ADS] [CrossRef] [EDP Sciences] [Google Scholar]
- Keto, E. R. 1991, ApJ, 371, 163 [NASA ADS] [CrossRef] [Google Scholar]
- Keto, E. 2002, ApJ, 568, 754 [NASA ADS] [CrossRef] [Google Scholar]
- Keto, E. 2003, ApJ, 599, 1196 [NASA ADS] [CrossRef] [Google Scholar]
- Keto, E., & Wood, K. 2006, ApJ, 637, 850 [NASA ADS] [CrossRef] [Google Scholar]
- Keto, E., & Zhang, Q. 2010, MNRAS, 406, 102 [NASA ADS] [CrossRef] [Google Scholar]
- Keto, E., Zhang, Q., & Kurtz, S. 2008, ApJ, 672, 423 [NASA ADS] [CrossRef] [Google Scholar]
- Klaassen, P. D., Wilson, C. D., Keto, E. R., & Zhang, Q. 2009, ApJ, 703, 1308 [NASA ADS] [CrossRef] [Google Scholar]
- Klaassen, P. D., Wilson, C. D., Keto, E. R., et al. 2011, A&A, 530, A53 [NASA ADS] [CrossRef] [EDP Sciences] [Google Scholar]
- Kratter, K. M., & Matzner, C. D. 2006, MNRAS, 373, 1563 [NASA ADS] [CrossRef] [Google Scholar]
- Kraus, S., Balega, Y., Elitzur, M., et al. 2006, A&A, 455, 521 [NASA ADS] [CrossRef] [EDP Sciences] [Google Scholar]
- Kraus, S., Hofmann, K., Menten, K. M., et al. 2010, Nature, 466, 339 [NASA ADS] [CrossRef] [MathSciNet] [PubMed] [Google Scholar]
- Kroupa, P. 2001, MNRAS, 322, 231 [NASA ADS] [CrossRef] [Google Scholar]
- Krumholz, M. R., Klein, R. I., & McKee, C. F. 2007, ApJ, 656, 959 [NASA ADS] [CrossRef] [Google Scholar]
- Krumholz, M. R., Klein, R. I., McKee, C. F., Offner, S. S. R., & Cunningham, A. J. 2009, Science, 323, 754 [NASA ADS] [CrossRef] [PubMed] [Google Scholar]
- Kuiper, R., Klahr, H., Beuther, H., & Henning, T. 2010, ApJ, 722, 1556 [CrossRef] [Google Scholar]
- Kuiper, R., Klahr, H., Beuther, H., & Henning, T. 2011, ApJ, 732, 20 [NASA ADS] [CrossRef] [Google Scholar]
- Kuiper, R., Klahr, H., Beuther, H., & Henning, T. 2012, A&A, 537, A122 [NASA ADS] [CrossRef] [EDP Sciences] [Google Scholar]
- Kumar, M. S. N., Keto, E., & Clerkin, E. 2006, A&A, 449, 1033 [NASA ADS] [CrossRef] [EDP Sciences] [Google Scholar]
- Linz, H., Stecklum, B., Henning, T., Hofner, P., & Brandl, B. 2005, A&A, 429, 903 [NASA ADS] [CrossRef] [EDP Sciences] [Google Scholar]
- López-Sepulcre, A., Codella, C., Cesaroni, R., Marcelino, N., & Walmsley, C. M. 2009, A&A, 499, 811 [NASA ADS] [CrossRef] [EDP Sciences] [Google Scholar]
- McKee, C. F., & Tan, J. C. 2002, Nature, 416, 59 [NASA ADS] [CrossRef] [PubMed] [Google Scholar]
- McKee, C. F., & Tan, J. C. 2003, ApJ, 585, 850 [NASA ADS] [CrossRef] [MathSciNet] [Google Scholar]
- Megeath, S. T., Wilson, T. L., & Corbin, M. R. 2005, ApJ, 622, L141 [NASA ADS] [CrossRef] [Google Scholar]
- Minier, V., Booth, R. S., & Conway, J. E. 2000, A&A, 362, 1093 [NASA ADS] [Google Scholar]
- Moscadelli, L., Reid, M. J., Menten, K. M., et al. 2009, ApJ, 693, 406 [NASA ADS] [CrossRef] [Google Scholar]
- Ossenkopf, V., & Henning, T. 1994, A&A, 291, 943 [NASA ADS] [Google Scholar]
- Pestalozzi, M. R., Elitzur, M., Conway, J. E., & Booth, R. S. 2004, ApJ, 603, L113 [NASA ADS] [CrossRef] [Google Scholar]
- Pestalozzi, M. R., Minier, V., Motte, F., & Conway, J. E. 2006, A&A, 448, L57 [NASA ADS] [CrossRef] [EDP Sciences] [Google Scholar]
- Pestalozzi, M. R., Elitzur, M., & Conway, J. E. 2009, A&A, 501, 999 [NASA ADS] [CrossRef] [EDP Sciences] [Google Scholar]
- Peters, T., Banerjee, R., Klessen, R. S., & Mac Low, M.-M. 2011, ApJ, 729, 72 [NASA ADS] [CrossRef] [Google Scholar]
- Pratap, P., Snyder, L. E., & Batrla, W. 1992, ApJ, 387, 241 [NASA ADS] [CrossRef] [Google Scholar]
- Puga, E., Marín-Franch, A., Najarro, F., et al. 2010, A&A, 517, A2 [NASA ADS] [CrossRef] [EDP Sciences] [Google Scholar]
- Qiu, K., Zhang, Q., & Menten, K. M. 2011, ApJ, 728, 6 [NASA ADS] [CrossRef] [Google Scholar]
- Reid, M. A., & Wilson, C. D. 2005, ApJ, 625, 891 [NASA ADS] [CrossRef] [Google Scholar]
- Rodón, J. A., Beuther, H., Megeath, T., & van der Tak, F. F. S. 2008, A&A, 490, 213 [NASA ADS] [CrossRef] [EDP Sciences] [Google Scholar]
- Sandell, G., & Sievers, A. 2004, ApJ, 600, 269 [NASA ADS] [CrossRef] [Google Scholar]
- Sandell, G., & Wright, M. 2010, ApJ, 715, 919 [NASA ADS] [CrossRef] [Google Scholar]
- Sandell, G., Wright, M., & Forster, J. R. 2003, ApJ, 590, L45 [NASA ADS] [CrossRef] [Google Scholar]
- Sandell, G., Goss, W. M., Wright, M., & Corder, S. 2009, ApJ, 699, L31 [NASA ADS] [CrossRef] [Google Scholar]
- Schreyer, K., Henning, T., van der Tak, F. F. S., Boonman, A. M. S., & van Dishoeck, E. F. 2002, A&A, 394, 561 [NASA ADS] [CrossRef] [EDP Sciences] [Google Scholar]
- Shepherd, D. S., Claussen, M. J., & Kurtz, S. E. 2001, Science, 292, 1513 [NASA ADS] [CrossRef] [PubMed] [Google Scholar]
- Sollins, P. K., Zhang, Q., Keto, E., & Ho, P. T. P. 2005, ApJ, 624, L49 [NASA ADS] [CrossRef] [Google Scholar]
- Surcis, G., Vlemmings, W. H. T., Torres, R. M., van Langevelde, H. J., & Hutawarakorn Kramer, B. 2011, A&A, 533, A47 [NASA ADS] [CrossRef] [EDP Sciences] [Google Scholar]
- Thronson, Jr., H. A., & Harper, D. A. 1979, ApJ, 230, 133 [NASA ADS] [CrossRef] [Google Scholar]
- van der Tak, F. F. S., van Dishoeck, E. F., & Caselli, P. 2000, A&A, 361, 327 [NASA ADS] [Google Scholar]
- Wang, K., Zhang, Q., Wu, Y., & Zhang, H. 2011, ApJ, 735, 64 [NASA ADS] [CrossRef] [Google Scholar]
- Werner, M. W., Becklin, E. E., Gatley, I., et al. 1979, MNRAS, 188, 463 [NASA ADS] [CrossRef] [Google Scholar]
- Willner, S. P. 1976, ApJ, 206, 728 [NASA ADS] [CrossRef] [Google Scholar]
- Wolfire, M. G., & Cassinelli, J. P. 1987, ApJ, 319, 850 [NASA ADS] [CrossRef] [Google Scholar]
- Wright, M., Zhao, J.-H., Sandell, G., et al. 2012, ApJ, 746, 187 [NASA ADS] [CrossRef] [Google Scholar]
- Wu, Y., Wei, Y., Zhao, M., et al. 2004, A&A, 426, 503 [NASA ADS] [CrossRef] [EDP Sciences] [Google Scholar]
- Yorke, H. W., & Sonnhalter, C. 2002, ApJ, 569, 846 [NASA ADS] [CrossRef] [Google Scholar]
- Yuan, L., Araya, E. D., Hofner, P., Kurtz, S., & Pihlstrom, Y. 2011, in AAS Meeting Abstracts #218, 129.04 [Google Scholar]
- Zhang, Q., Hunter, T. R., Sridharan, T. K., & Ho, P. T. P. 2002, ApJ, 566, 982 [NASA ADS] [CrossRef] [Google Scholar]
- Zhang, Q., Hunter, T. R., Brand, J., et al. 2005, ApJ, 625, 864 [NASA ADS] [CrossRef] [Google Scholar]
- Zhang, Q., Wang, Y., Pillai, T., & Rathborne, J. 2009, ApJ, 696, 268 [NASA ADS] [CrossRef] [Google Scholar]
- Zheng, X.-W., Zhang, Q., Ho, P. T. P., & Pratap, P. 2001, ApJ, 550, 301 [NASA ADS] [CrossRef] [Google Scholar]
All Tables
All Figures
|
Fig. 1 Overview of the NGC 7538 complex. The grey-scale presents the K-band image from Puga et al. (2010), and the contours show the single-dish 1.2 mm continuum data from Sandell & Sievers (2004). The colored stars and circles show the central positions and FWHM of the primary beam of the PdBI at 1.3 mm wavelength for NGC 7538IRS1 and NGC 7538S in the north and south, respectively. The contour levels are from 250 mJy beam-1 to 5.25 Jy beam-1 in steps of 500 mJy beam-1. The beam of the 30 m observations and a scale-bar are shown at the bottom-left and right, respectively. |
| In the text | |
|
Fig. 2 PdBI 1.36 mm continuum images toward NGC 7538IRS1 and NGC 7538S in the left and right panel, respectively. The contour levels start at 4σ values and continue in 8σ and 4σ steps for NGC 7538IRS1 and NGC 7538S (1σ values are 29 mJy beam-1 and 0.7 mJy beam-1, respectively). Several potential disk and outflow axis reported in the literature are presented (Davis et al. 1998; De Buizer & Minier 2005; Sandell et al. 2009; Pestalozzi et al. 2004, 2009; Sandell & Wright 2010, see Introduction for more details). The open stars, square, triangle and six-pointed star mark the positions of the OH, H2O, class ii CH3OH and H2CO masers (Argon et al. 2000; Kameya et al. 1990; Pestalozzi et al. 2006; Hoffman et al. 2003). A scale-bar and the synthesized beam are shown in both panels. The box zooms into the region around mm1 in more detail. The coordinates are relative to the phase centers given in Sect. 2. |
| In the text | |
|
Fig. 3 CH3CN(12k − 11k) spectra for k = 0...3 toward the 1.36 mm continuum peak (top panel) and a reference position offset by 0.2′′/ − 1.1′′ from NGC 7538IRS1. The velocity of rest is always marked with a vertical line. |
| In the text | |
|
Fig. 4 The left and right panels present in color, respectively, the 1st and 2nd moment maps in CH3CN(126 − 116) toward NGC 7538IRS1. The contours show the 1.36 mm continuum emission with the same contour levels as in Fig. 2. A scale-bar and the synthesized beam are presented in each panel. The line in the left panel outlines the axis for the pv-cuts in Figs. 5 and 6. |
| In the text | |
|
Fig. 5 Selected position-velocity diagrams for NGC 7538IRS1 along the axis in Fig. 4. The presented molecules and their transitions are labeled above each panel, the approximate vlsr ≈ − 57.3 km s-1 is marked as well. The black lines in all panels correspond to Keplerian rotation curves around a 30 M⊙ central object. The units of the wedges are Jy beam-1. |
| In the text | |
|
Fig. 6 Selected position-velocity diagrams for NGC 7538IRS1 along the axis in Fig. 4. The presented molecules and their transitions are labeled above each panel, the approximate vlsr ≈ − 57.3 km s-1 is marked as well. The units of the wedges are Jy beam-1. |
| In the text | |
|
Fig. 7 Spectra toward the 1.36 mm continuum peak of NGC 7538IRS1 for selected lines as marked in each panel. The velocity of rest is marked by a line. |
| In the text | |
|
Fig. 8 The color scale presents in the left and right panels, the first and second moment maps (intensity weighted peak velocities and line widths) toward NGC 7538S. The molecular lines are marked in each panel. The contours show the 1.36 mm continuum in 4σ steps (1σ ~ 0.7 mJy beam-1). The synthesized beam and a scale-bar are presented in each panel. The lines outline the axis used for the pv-cuts in Figs. 9 and 10. |
| In the text | |
|
Fig. 9 Position velocity cuts through NGC 7538S mm1 in several lines as marked in each panel along the axis shown in Fig. 8, respectively. The vlsr is marked. Offset 0 corresponds to the peak of mm1a. The units of the wedges are Jy beam-1. |
| In the text | |
|
Fig. 10 Position velocity cuts through NGC 7538S mm2 in several lines as marked in each panel along the axis shown in Fig. 8, respectively. The vlsr is marked. The full and dotted lines in the OCS panel correspond to Keplerian rotation curves around a 1 and 10 M⊙ star, respectively. The units of the wedges are Jy beam-1. |
| In the text | |
|
Fig. 11 CH3CN(12k − 11k) spectra (0 ≤ k ≤ 3) toward NGC 7538S mm1a (black) and mm2 (red). |
| In the text | |
|
Fig. 12 CH3CN(125 − 115) and HC3N(24 − 23) spectra toward NGC 7538S mm1a and mm2. |
| In the text | |
Current usage metrics show cumulative count of Article Views (full-text article views including HTML views, PDF and ePub downloads, according to the available data) and Abstracts Views on Vision4Press platform.
Data correspond to usage on the plateform after 2015. The current usage metrics is available 48-96 hours after online publication and is updated daily on week days.
Initial download of the metrics may take a while.