Fig. 1
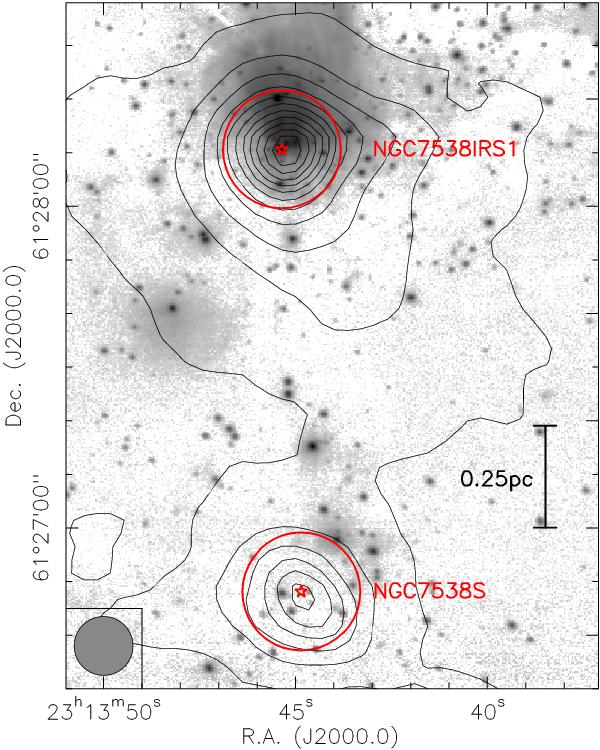
Overview of the NGC 7538 complex. The grey-scale presents the K-band image from Puga et al. (2010), and the contours show the single-dish 1.2 mm continuum data from Sandell & Sievers (2004). The colored stars and circles show the central positions and FWHM of the primary beam of the PdBI at 1.3 mm wavelength for NGC 7538IRS1 and NGC 7538S in the north and south, respectively. The contour levels are from 250 mJy beam-1 to 5.25 Jy beam-1 in steps of 500 mJy beam-1. The beam of the 30 m observations and a scale-bar are shown at the bottom-left and right, respectively.
Current usage metrics show cumulative count of Article Views (full-text article views including HTML views, PDF and ePub downloads, according to the available data) and Abstracts Views on Vision4Press platform.
Data correspond to usage on the plateform after 2015. The current usage metrics is available 48-96 hours after online publication and is updated daily on week days.
Initial download of the metrics may take a while.