Fig. 8
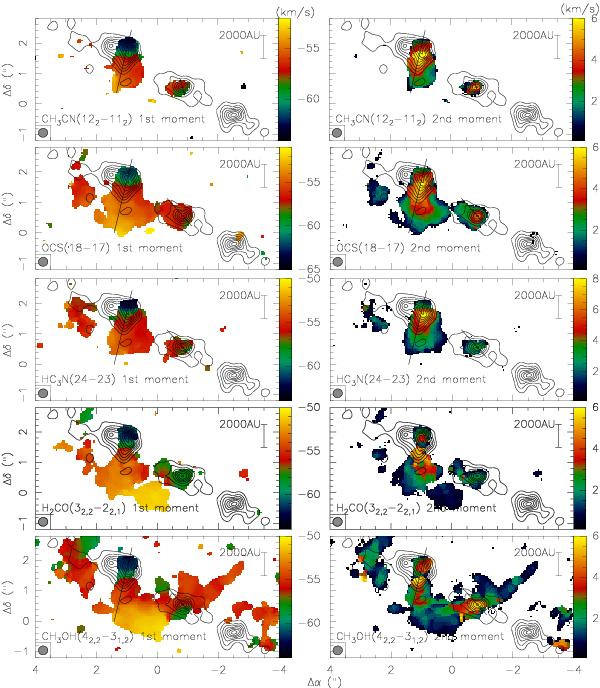
The color scale presents in the left and right panels, the first and second moment maps (intensity weighted peak velocities and line widths) toward NGC 7538S. The molecular lines are marked in each panel. The contours show the 1.36 mm continuum in 4σ steps (1σ ~ 0.7 mJy beam-1). The synthesized beam and a scale-bar are presented in each panel. The lines outline the axis used for the pv-cuts in Figs. 9 and 10.
Current usage metrics show cumulative count of Article Views (full-text article views including HTML views, PDF and ePub downloads, according to the available data) and Abstracts Views on Vision4Press platform.
Data correspond to usage on the plateform after 2015. The current usage metrics is available 48-96 hours after online publication and is updated daily on week days.
Initial download of the metrics may take a while.