Fig. 2
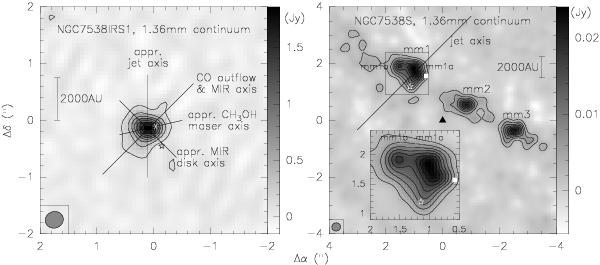
PdBI 1.36 mm continuum images toward NGC 7538IRS1 and NGC 7538S in the left and right panel, respectively. The contour levels start at 4σ values and continue in 8σ and 4σ steps for NGC 7538IRS1 and NGC 7538S (1σ values are 29 mJy beam-1 and 0.7 mJy beam-1, respectively). Several potential disk and outflow axis reported in the literature are presented (Davis et al. 1998; De Buizer & Minier 2005; Sandell et al. 2009; Pestalozzi et al. 2004, 2009; Sandell & Wright 2010, see Introduction for more details). The open stars, square, triangle and six-pointed star mark the positions of the OH, H2O, class ii CH3OH and H2CO masers (Argon et al. 2000; Kameya et al. 1990; Pestalozzi et al. 2006; Hoffman et al. 2003). A scale-bar and the synthesized beam are shown in both panels. The box zooms into the region around mm1 in more detail. The coordinates are relative to the phase centers given in Sect. 2.
Current usage metrics show cumulative count of Article Views (full-text article views including HTML views, PDF and ePub downloads, according to the available data) and Abstracts Views on Vision4Press platform.
Data correspond to usage on the plateform after 2015. The current usage metrics is available 48-96 hours after online publication and is updated daily on week days.
Initial download of the metrics may take a while.