| Issue |
A&A
Volume 543, July 2012
|
|
|---|---|---|
| Article Number | A129 | |
| Number of page(s) | 17 | |
| Section | Extragalactic astronomy | |
| DOI | https://doi.org/10.1051/0004-6361/201219113 | |
| Published online | 10 July 2012 | |
Self-gravitating equilibrium models of dwarf galaxies and the minimum mass for star formation⋆
1 University of Vienna, Institute of Astrophysics, 1180 Vienna, Austria
e-mail: This email address is being protected from spambots. You need JavaScript enabled to view it.
2 Research Institute of Physics, Southern Federal University, 344090 Rostov-on-Don, Russia
Received: 24 February 2012
Accepted: 4 May 2012
Abstract
Context. We constructed a series of model galaxies in rotational equilibrium consisting of gas, stars, and a fixed dark matter (DM) halo and studied how these equilibrium systems depend on the mass and form of the DM halo, gas temperature, non-thermal and rotation support against gravity, and also on the redshift of galaxy formation. For every model galaxy we found the minimum gas mass Mgmin required to achieve a state in which star formation (SF) is allowed according to contemporary SF criteria. The obtained Mgmin–MDM relations were compared against the baryon-to-DM mass relation Mb–MDM inferred from the ΛCDM theory and WMAP4 data.
Aims. Our aim is to construct realistic initial models of dwarf galaxies (DGs), which take into account the gas self-gravity and can be used as a basis to study the dynamical and chemical evolution of DGs.
Methods. Rotating equilibria are found by solving numerically the steady-state momentum equation for the gas component in the combined gravitational potential of gas, stars, and DM halo using a forward substitution procedure.
Results. We find that for a given MDM the value of Mgmin depends crucially on the gas temperature Tg, gas spin parameter α, degree of non-thermal support σeff, and somewhat on the redshift for galaxy formation zgf. Depending on the actual values of Tg, α, σeff, and zgf, model galaxies may have Mgmin that are either greater or smaller than Mb. Galaxies with MDM ≳ 109 M⊙ are usually characterized by Mgmin ≲ Mb, implying that SF in such objects is a natural outcome because the required gas mass is consistent with what is available according to the ΛCDM theory. On the other hand, models with MDM ≲ 109 M⊙ are often characterized by Mgmin ≫ Mb, implying that they need much more gas than available to achieve a state in which SF is allowed.
Conclusions. Our modeling suggests that a star-formation-allowed state is more difficult to achieve in DM halos with mass ≲ 109 M⊙ than in their upper-mass counterparts, because the required gas mass often exceeds both Mb and MDM. In the framework of the ΛCDM theory, this implies the existence of a critical DM halo mass below which the likelihood of star formation and hence the total stellar mass may drop substantially, in accordance with the stellar versus DM halo mass relations recently derived from the SDSS survey and millennium simulations. On the other hand, DGs that do not follow the ΛCDM trend are feasible and have recently been identified, which raises questions about the universality of the ΛCDM paradigm.
Key words: galaxies: dwarf / galaxies: structure / ISM: structure / stars: formation / methods: numerical / dark matter
Appendices are available in electronic form at http://www.aanda.org
© ESO, 2012
1. Introduction
The study of equilibrium states of self-gravitating, multi-component fluids is of considerable interest in astronomy because they serve as basic models of many astrophysical objects (stars, protoplanetary disks, and galaxies, to name a few). While it is known (and quite obvious from simple symmetry considerations) that isolated, non-rotating, self-gravitating fluids of finite extent must be spherically symmetric, it has been a formidable endeavour for some of the most distinguished astronomers and mathematicians of the last three centuries to discover the figures of equilibrium in the presence of rotation. In particular, the discovery of Jacobi in 1834 that equilibrium figures of uniformly rotating fluids need not be axisymmetric took the scientific community by surprise. The formidable body of knowledge on (incompressible and uniformly rotating) equilibrium figures has been completed, corrected and consolidated only recently (Chandrasekhar 1969; Tassoul 1978).
Unfortunately, this knowledge has proven to be inadequate for the study of equilibrium configurations in galaxies mainly for two reasons: (i) the gas in galaxies is not incompressible, (ii) galaxies are not uniformly rotating. Fortunately enough, non-axisymmetric structures of equilibrium are secularly transformed into axisymmetric figures in realistic (compressible, viscous and differentially rotating) models of galaxies (e.g. Lindblom 1992). It is therefore always realistic to assume that the equilibrium configuration of a galaxy rotating about some axis is axisymmetric. It is however not always true that this figure of equilibrium is an ellipsoid. Rapidly rotating, compressible gases characterized by a polytropic equation of state quite naturally develop a flared structure (Bodenheimer & Ostriker 1973; Tassoul 1978). Flaring gas distributions in some DGs have been inferred (O’Brien et al. 2010; Banerjee et al. 2011) but direct observations of flaring gas disks are technically very difficult, even if DGs are edge-on (Sancisi & Allen 1979). Nevertheless, moderate flaring has been observed in the Galaxy (Kent et al. 1991; Kalberla & Kerp 2009) and in M 31 (Brinks & Burton 1984) and it is therefore reasonable to expect flaring also in some gas-rich DGs. Because of the complex geometries (and, often, of the rotation curves) of realistic galaxies, it is extremely complex (if not impossible) to analytically compute figures of equilibrium and one must resort to numerical methods.
An equilibrium model without gas self-gravity suffers from two major drawbacks. First, such models in principle cannot be used to infer equilibrium configurations prone to star formation since the star formation criteria explicitly or implicitly rely on self-gravity as one of the key ingredients for star formation. This lack of self-consistency may lead to situations where the star formation feedback caused by supernova explosions is studied in models, in which star formation may have never been realized in the first place. Second, if one neglects gas self-gravity, one runs the risk of building a gravitationally overstable configuration, which would never have been realized if self-gravity had been taken into account. Such a non-self-gravitating configuration would have too much gas compared to the self-gravitating counterpart, and additional theoretical or empirical criteria are usually invoked to constrain the total gas mass (see e.g. Mac Low & Ferrara 1999; Vasiliev et al. 2008). Moreover, the energy release and the corresponding SF rates are often set arbitrarily (e.g. Mac Low & Ferrara 1999).
This paper is the first of a series of works dealing with the dynamical and chemical evolution of gas and stars in DGs embedded in dark matter (DM) halos. In the context, achieving an initial equilibrium configuration is clearly necessary in order to study how the onset of an episode of star formation or of another perturbing phenomenon affects the evolution of the studied object. Surprisingly, almost all papers on this subject so far neglected self-gravity of gas and stars and considered a simplified initial equilibrium configuration, namely a rotating isothermal gas distribution in hydrostatic equilibrium with a fixed potential well (a DM halo or a static distribution of stars; see e.g. Suchkov et al. 1994; Mac Low & Ferrara 1999; Strickland & Stevens 2000; Recchi et al. 2001; Marcolini et al. 2003; Vorobyov et al. 2004; Scannapieco & Brüggen 2010, among many others).
In this work, we solve numerically the steady-state momentum equation of a multi-component galaxy (made of gas, stars and a DM halo) taking into account the gravitational acceleration of all these components. This task has been attempted only by very few authors (Narayan & Jog 2002; Harfst et al. 2006; Banerjee et al. 2011). The typical justification for neglecting gas self-gravity in constructing initial equilibrium models for DGs is that “the gravitational potential of DGs with Mg ≲ 109 M⊙ is dominated by the dark matter halo” (Mac Low & Ferrara 1999). However, it is worth recalling that some authors still doubt the presence of massive DM halos around DGs. For instance, recent observations of the mass-to-light ratios in Virgo Cluster dwarf ellipticals by Toloba et al. (2011) and in gas-rich DGs by Swaters et al. (2011) and also studies of structural properties of the Milky Way dwarf spheroidals (see e.g. Kroupa et al. 2010, and references therein) are substantially questioning the contribution of DM on small scales.
Moreover (and more importantly), even if the total mass of a dwarf galaxy is dominated by a DM halo, most of the galaxy consists of baryons within the Holmberg radius (see e.g. Papaderos et al. 1996; Swaters et al. 2011), although some authors have reported different claims (e.g. Carignan & Beaulieu 1989). In some numerical works (which neglected gas self-gravity) it can be clearly noticed that the assumed DM profile leads to a very low density of the DM component (much lower than the gas density) in the central region of the simulated galaxy (for instance in D’Ercole & Brighenti 1999, the central gas density is ~ 10 times higher than the DM density). Central densities of the DM halos in DGs can also be inferred from the observed rotation curves, and typical values are quite low; significantly below 10-24 g cm-3 (de Blok et al. 2008). We can therefore conclude that it is very unlikely that gas self-gravity is negligible in the central parts of gas-rich DGs. All the above arguments in favor of gas self-gravity clearly show the relevance of the present study.
The plan of the paper is as follows. The basics of the numerical model are described in Sect. 2. The initial and boundary conditions, as well as the solution procedure, are summarized in Sect. 3. The main results are presented in Sects. 4 and 5. A comparison of our results with predictions of the ΛCDM theory is given in Sect. 6. The implications for the evolution of DGs and the model caveats are discussed in Sects. 7 and 8, respectively. The main conclusions are summarized in Sect. 9.
2. Numerical model
An accurate construction of self-gravitating, rotating equilibria involves solving for the steady-state momentum equations of gas, stars, and dark matter in their combined gravitational potential. This is however a difficult and time consuming numerical exercise, because the density distribution of each component depends on the total gravitational potential, which in turn depends on the spatial distribution of each component. We simplify our task by making two assumptions. First, we neglect the contribution by the stellar component to the total gravitational potential throughout most of the paper and return to quantify this effect in Sect. 5.3. Second, we assume that the DM halo has a fixed form and hence a fixed gravitational potential. We note that this assumption may break down on timescales much longer than a galactic orbital period. We plan to investigate the response of the DM halo in a follow-up study.
The resulting steady-state momentum equation for the gas component in the total gravitational potential of gas and dark matter takes the following form. 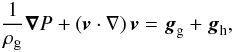 (1)where
  is the gas pressure, σg is the one-dimensional gas velocity dispersion, ρg is the gas volume density, v is the gas velocity, and gg and gh are the gravitational accelerations due to the gas and DM halo, respectively. The gravitational acceleration gg is calculated as gg = −∇Φ, where the gas gravitational potential Φ is obtained via the solution of the Poisson equation
 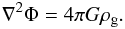 (2)For rotating equilibria, it is most convenient to expand Eq. (1) in cylindrical coordinates (r,z) with imposed axial symmetry, i.e., ∂/∂φ = 0. A steady-state solution implies that vz = 0 and vr = 0 (but vφ ≠ 0) and the resulting equations are
  In this study, we assume that the gas temperature is spatially uniform (see Sect. 3.2), which implies that the spatial derivatives of
  are zeroed.
Equations (3) and (4) are discretized using a first-order backward-difference scheme on a cylindrical mesh with 600 × 600 grid points assuming the axial and midplane symmetry around the z-axis (r = 0) and the midplane z = 0, respectively. The resulting set of 6002 linear equations is solved using a forward substitution scheme explained in detail in the Appendix.
3. Initial conditions
3.1. Dark matter halo setup
To solve Eqs. (3) and (4) for the gas density ρg, one needs to specify the form of the DM halo. We consider two distributions that are most often used to fit the rotation curves of DGs. The first choice is a quasi-isothermal sphere, which has a flat near-central density distribution and a tail inversely proportional to the square of the distance from the galactic center ϖ = (z2 + r2)1/2 and is described by the following equation  (5)The central density ρ0 and the characteristic scale length of the quasi-isothermal halo can be calculated using the following relations (e.g. Mac Low & Ferrara 1999; Silich & Tenorio-Tagle 2001)1
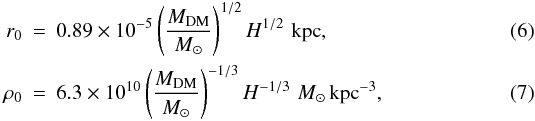 where MDM is the mass of the DM halo contained within the virial radius
  (8)We note that for a fixed H (set to 0.65 in the current paper for consistency with the work of Mac Low & Ferrara 1999) the quasi-isothermal halo is uniquely determined by a choice of MDM. Finally, the gravitational acceleration of the quasi-isothermal halo can be written as
 ![Mathematical equation: \begin{equation} {\bl g}_{\rm h}= - 4\pi G \rho_0 r_0^3/\varpi^2 \left[ \varpi/r_0 - \arctan\left( \varpi/r_0\right) \right] {\bl e}_\ast, \end{equation}](/articles/aa/full_html/2012/07/aa19113-12/aa19113-12-eq48.png) (9)where e ∗ = ϖ/ϖ is the unit vector.
(9)where e ∗ = ϖ/ϖ is the unit vector.
The second choice for the form of the DM halo is the well-known Navarro, Frenk & White (NFW) density profile suggested by Navarro et al. (1997), which features a cuspy profile in the inner regions and a tail inversely proportional to ϖ3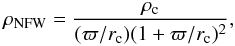 (10)where ρc and rc are free parameters. The mass of the DM halo contained within radius ϖ can be expressed as
 ![Mathematical equation: \begin{equation} M_{\rm DM} (\varpi) = {M_{\rm DM} \over f(c)} \left[\ln(1+x) - {x \over 1+x} \right], \end{equation}](/articles/aa/full_html/2012/07/aa19113-12/aa19113-12-eq55.png) (11)where x = ϖc/ϖvir, f(c) = ln(1 + c) − c/(1 + c), c is the concentration parameter, and the virial radius ϖvir is defined by Eq. (8). The concentration parameter is determined from the statistics of the ΛCDM halo concentrations by Neto et al. (2007)
(11)where x = ϖc/ϖvir, f(c) = ln(1 + c) − c/(1 + c), c is the concentration parameter, and the virial radius ϖvir is defined by Eq. (8). The concentration parameter is determined from the statistics of the ΛCDM halo concentrations by Neto et al. (2007)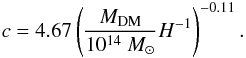 (12)Finally, the gravitational acceleration due to the NFW halo can be calculated as
 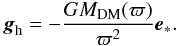 (13)A DM distribution profile, somewhat intermediate between the NFW and the quasi-isothermal profiles, has been semi-empirically introduced by Burkert (1995). It is described by the following equation:
 ![Mathematical equation: \begin{equation} \label{burkert} \rho_{\rm Burk}= {\rho_{\rm c} \over (1+\varpi/r_{\rm c}) [1+(\varpi/r_{\rm c})^2]}\cdot \end{equation}](/articles/aa/full_html/2012/07/aa19113-12/aa19113-12-eq62.png) (14)It is therefore a cored profile (such as the quasi-isothermal one) which, in analogy to the NFW profile, declines at large radii as ϖ-3. Although this profile fits the rotation curves of DGs well (Burkert 1995; Salucci & Burkert 2000), we have not taken it into consideration, because the results adopting this profile are intermediate between the results with a (cuspy) NFW and a (cored) quasi-isothermal profile. As we show in Sect. 5.2, our results depend very little on the DM profile, hence, for the sake of conciseness, we have not considered the Burkert profile.
(14)It is therefore a cored profile (such as the quasi-isothermal one) which, in analogy to the NFW profile, declines at large radii as ϖ-3. Although this profile fits the rotation curves of DGs well (Burkert 1995; Salucci & Burkert 2000), we have not taken it into consideration, because the results adopting this profile are intermediate between the results with a (cuspy) NFW and a (cored) quasi-isothermal profile. As we show in Sect. 5.2, our results depend very little on the DM profile, hence, for the sake of conciseness, we have not considered the Burkert profile.
3.2. The gas temperature
The thermal properties of gas affect the form of the resulting equilibrium configuration. A fully self-consistent approach requires solving for the thermal balance equation along with the steady-state Eqs. (3) and (4). This, however, entails a considerable increase in calculation time and, sometimes, results in poor convergence.
In this study, we take a simpler approach and build equilibrium configurations for a pre-defined gas temperature. This approach is justified if the characteristic cooling/heating time of gas is much shorter than the dynamical time. The pre-defined gas temperatures are varied on a wide range, starting from 100 K, typical for the cold atomic clouds, to a few × 104 K, typical for the warm diffuse gas.
3.3. Rotational versus thermal support
To construct rotating equilibria, one needs to specify the form of the rotation curve. A common approach is to set the rotation velocity of gas vφ to the circular velocity vcirc, thus assuming that the support against gravity comes mainly from rotation2 (e.g. Mac Low & Ferrara 1999). Such assumption, if made without corroboration of data, may produce flattened gaseous disks with surface densities nearly independent of galactic radius or even increasing outward, which is unlikely considering what we know from real systems3.
A more general and realistic approach is to assume that part of the support against gravity comes from pressure gradients and to set vφ = αvcirc, where α is the spin parameter that determines the relative contribution of rotation to the total support against gravity. For α = 1, the gas disk is almost totally supported by rotation, whereas for α = 0 the disk is thermally supported. The resulting expression for the rotational velocity of gas is ![Mathematical equation: \begin{equation} \label{rotation} v_{\rm \phi} = \alpha \left[r \left( \left|g_{{\rm h},r}(z=0)\right| + \left|g_{{\rm g},r}(z=0)\right| \right) \right]^{1/2}, \end{equation}](/articles/aa/full_html/2012/07/aa19113-12/aa19113-12-eq70.png) (15)where the subscript r denotes the radial component of the gravitational accelerations, the latter being calculated in the midplane z = 04. This choice makes the rotation velocity z-independent, in concordance with the Poincaré-Wavre theorem (Lebovitz 1967) for a barotropic gas in rotation equilibrium. More realistic rotating equilibria with a negative vertical gradient of vφ require considering a more general baroclinic gas (Barnabé et al. 2006), which is out of the scope of the present study. Throughout most of the paper, we use α = 0.9 (Tomisaka & Ikeuchi 1988; Strickland & Stevens 2000) and explore the dependence of our results on lower values of α in Sect. 5.1.
(15)where the subscript r denotes the radial component of the gravitational accelerations, the latter being calculated in the midplane z = 04. This choice makes the rotation velocity z-independent, in concordance with the Poincaré-Wavre theorem (Lebovitz 1967) for a barotropic gas in rotation equilibrium. More realistic rotating equilibria with a negative vertical gradient of vφ require considering a more general baroclinic gas (Barnabé et al. 2006), which is out of the scope of the present study. Throughout most of the paper, we use α = 0.9 (Tomisaka & Ikeuchi 1988; Strickland & Stevens 2000) and explore the dependence of our results on lower values of α in Sect. 5.1.
3.4. Boundary conditions
The final step is to specify the values of gas volume density ρg at the boundaries. We used a computational box with physical dimensions of 8.0 kpc along the r- and z-axes, with the spatial resolution of 13.3 pc along each coordinate direction. Reflecting boundary conditions at the z- and r-axes are a natural choice. In addition, one needs to define the bounding pressure, i.e., the values of ρg and σg at the outer z- and r-boundaries, if a galaxy is submerged in a dense and hot intra-cluster medium. These values, however, are essentially free parameters, because they depend on the environment. Accordingly, we decided to take a different approach and defined the value of the gas number density n0,0 in the innermost computational cell near the origin (z = 0,r = 0). This value is kept fixed throughout the iterative solution procedure (described below) and serves as a “seed” density needed to solve Eqs. (3) and (4). Increasing/decreasing the value of n0,0 would yield more/less massive gaseous disks of different spatial configuration. Thus, at variance with Mac Low & Ferrara (1999), our model galaxies do not have a disk cutoff radius. On the other hand, because of that, ours are truly equilibrium configurations and the disk does not tend to expand into the intracluster medium as in Mac Low & Ferrara (see the test problem in the appendix).
The choice of α, σg and n0,0, along with the mean molecular weight μ = 1.26 (for a metallicity of 1/100 that of the solar) and reflecting boundary conditions at the z- and r-axes, completes the initial setup and allows us to calculate equilibrium configurations of gaseous disks for different shapes and masses of the DM halo. The bounding effect of the external environment will be addressed in a future study.
 |
Fig. 1 Schematic representation of the iterative solution procedure to calculate rotating, self-gravitating gaseous equilibria in DM halos. |
3.5. The solution procedure
One can notice that, because gg is obtained through the solution of the Poisson Eq. (2), Eqs. (3) and (4) are transcendental and therefore require an iterative solution procedure, which is described schematically in Fig. 1. The calculation begins with a) choosing the DM halo profile (quasi-isothermal sphere or NFW halo), b) calculating the corresponding gravitational acceleration gh, c) fixing the thermal properties of gas, i.e., the gas temperature, and d) making an initial guess for the gas volume density ρg,init and rotational velocity vφ,init. For the the gas volume density we usually choose a spatially uniform distribution with ρg = mH μ n0,0 and the rotation velocity is determined from Eq. (15). Finally, the gravitational acceleration gg of the gas configuration is calculated by solving for the Poisson equation using the alternative direction implicit method as described in Black & Bodenheimer (1975) and Stone & Norman (1992).
The first loop of iterations begins with solving for the steady-state Eqs. (3) and (4). The resulting gas density ρg is compared against the initial guess ρg,init for every computational cell, and if the maximum relative error ϵ is larger than 10-5, the iteration cycle is repeated by setting ρg,init = ρg and calculating new gravitational potential and rotation curve of the gas disk. Usually, convergence was achieved after 10–15 iterations, but sometimes not, which signalized an inappropriate initial guess for n0,0 or α, especially when n0,0 is large and the corresponding equilibrium solution near the rotation axis is characterized by a narrow, high-density plateau, which is difficult to resolve numerically.
4. Self-gravitating equilibrium gaseous disks
4.1. Star formation criteria
We built equilibrium gaseous disks hosted by DM halos of various mass and shape and determined the minimum gas mass needed to trigger star formation in these systems. Three criteria were employed to assess if star formation is possible in our model galaxies. The first criterion is based on theoretical considerations of gravitational stability in self-gravitating systems. We assume that star formation is allowed if the Toomre Q parameter  (16)is smaller than a critical value Qc, where ν is the epicycle frequency and Σ is the gas surface density. The classical analysis of thin, axisymmetric gaseous disks suggests a value of Qc = 1.0 (Toomre 1964), but Qc in real systems is usually somewhat greater and may depend on many factors including the galaxy class, the form of the rotation curve, the disk thickness, the strength of magnetic fields, etc. (e.g. Polyachenko et al. 1997; Kim & Ostriker 2001; Bigiel et al. 2008; Leroy et al. 2008; Dong et al. 2008; Roychowdhury et al. 2009). In this study, we chose a conservative value of Qc = 2.0 and assumed that our model galaxy is prone to star formation if QT < Qc in at least some parts of the gas disk.
For the second star formation criterion, we used empirical studies of star formation in the Local Universe by Kennicutt (1998, 2008) who compared disk-averaged star formation rates (per unit area) versus gas surface densities in normal and starburst galaxies, including DGs. These studies suggest the following scaling law (hereafter, the Kennicutt-Schmidt law) between the star formation rate per unit area ΣSFR(M⊙ yr-1 kpc-2) and the gas surface density Σ(M⊙ pc-2) 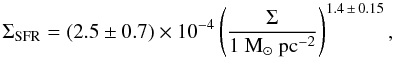 (17)with a threshold density Σc of about 5.0 M⊙ pc-2, below which only very rare cases of large-scale star formation are detected. Therefore, we used this value as the second star formation criterion and assumed that star formation can be triggered in our model galaxies if Σ > Σc.
So far, we have used vertically integrated gas densities to assess the model’s susceptibility to star formation. However, star formation recipes may also rely on the critical gas volume density nc, as is often assumed in numerical hydrodynamics simulations. Moreover, as discussed in Elmegreen (1997), a Schmidt law with index 1.5 would be expected for self-gravitating disks, if the SF rate is equal to the ratio of the local gas volume density to the free-fall time, all multiplied by some efficiency. The adopted values of nc vary within wide limits, depending on the numerical resolution but most studies use values of the order of 0.1–1.0 cm-3 (e.g. Springel & Hernquist 2003; Schaye & Dalla Vecchia 2008), though some authors adopted much higher values (e.g. Tasker 2011).
In this paper, we assumed that SF is allowed if there is enough gas mass (in the vertical column that fulfils the first two criteria) with number density ng higher than a fiducial critical value of nc = 1.0 cm-3 to allow for a SF event of non-negligible magnitude, i.e., if 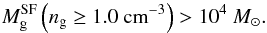 (18)We chose to set a limit in mass rather than in size because star formation may be localized to just a few tens of parsec, yet contain enough gas mass for a star formation event of notable magnitude. Finally, a model galaxy was assumed to be prone to star formation only if all three criteria were satisfied simultaneously.
Quasi-isothermal DM halo parameters.
4.2. Equilibrium models
Throughout most of the paper, we use a quasi-isothermal DM halo with four different masses MDM = 107 M⊙, 108 M⊙, 109 M⊙, and 1010 M⊙. The corresponding values for r0, ρ0, and ϖ are listed in Table 1. We set the gas spin parameter to α = 0.9 and the gas temperature Tg to a spatially uniform value that is either independent of the halo mass (Tg = 104 K) or scales with the DM mass as  , as suggested by the virial relations. We consider the effect of varying rotational support against gravity (i.e., varying α) in Sect. 5.1, the effect of a different DM halo configuration (i.e., the NFW halo) in Sect. 5.2, and the effect of a non-negligible stellar disk in Sect. 5.3.
To put things in the physical context, the models considered here and in Sects. 5–5.2 (with a gas distribution in equilibrium with a DM halo, waiting for the onset of star formation) can be considered as progenitors of, e.g., blue compact dwarf galaxies whose stellar populations are largely dominated by very young stars (Papaderos et al. 2008). In Sect. 5.3 we describe objects with a pre-existing disk of stars that have smoothly accreted gas and have achieved a new equilibrium configuration (galaxies surrounded by extended gas reservoirs are quite common, see e.g. van Zee et al. 1998, for the case of I Zw 18). Finally, in Sect. 5.4 we assume a redshift of galaxy formation significantly higher than zero. Therefore, our equilibrium configurations should be treated as proxies to DGs that have built up their gas mass reservoir by quasi-steady accretion or have temporally achieved a quasi-steady state after an episode of fast accretion.
Figure 2 presents gas surface densities Σ (left column), Toomre Q parameters (middle column), and gas rotation velocities vφ (right column) for various steady-state gaseous disks with MDM ranging from 1010 M⊙ (top row) to 107 M⊙ (bottom row). The spin parameter and the spatially constant gas temperature are the same for all models and are equal to 0.9 and 104 K, respectively. For calculating the Q parameter and vφ we used mass-weighting according to the gas mass contained in every computational cell. The gas surface density was obtained by integrating ρg along the z-axis.
For each value of MDM, we considered five models with different seed values of the gas number density n0,0, namely, 0.01, 0.1, 1.0, 5.0, and 25 cm-3. These models are marked in Fig. 2 by lines of different style, with the dotted lines corresponding to n0,0 = 0.01 cm-3 and dashed lines to n0,0 = 25 cm-3 (and the other models in between in the order of increasing n0,0). The highest/lowest values of n0,0 produce models with highest/lowest gas surface densities near the galactic center.
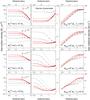 |
Fig. 2 Gas surface densities (left column), Toomre Q parameters (middle column), and rotation velocities (right column) of self-gravitating (steady-state) gaseous disk hosted by quasi-isothermal DM halos with four masses MDM as indicated in the right-hand column. The spatially uniform gas temperature and the spin parameter are set to Tg = 104 K and α = 0.9, respectively. The horizontal dotted lines mark the adopted critical surface density for star formation Σc = 5 M⊙ pc2 (left column) and the critical Toomre parameter Qcr for gravitational stability (middle column). For every value of MDM, five models with different values of the seed density n0,0 = 25.0, 5.0, 1.0, 0.1, and 0.01 cm-3 from the uppermost to the lowermost line are considered. Higher n0,0 produce models with higher gas surface densities in the inner regions. The models that are susceptible to star formation according to the adopted star formation criteria are marked with red thick lines and the gas mass |
The radial profiles of Σ in Fig. 2 indicate that models with lower values of MDM produce less centrally concentrated gaseous distributions. Indeed, models with MDM = 1010 M⊙ have a density tail proportional to r-2, whereas models with MDM ≤ 108 M⊙ are characterized by Σ ∝ r-1.1. This tendency can be explained by the fact that the mass of the gas disk starts to systematically exceed that of the DM halo for MDM ≤ 109 M⊙, the effect is discussed in more detail in Sect. 5. As a result, the shape of the gas disk in models with MDM ≤ 109 M⊙ is mostly determined by self-gravity of the gas, with the resulting distribution approaching that of a self-gravitating isothermal ellipsoid with the density tail ρg ∝ ϖ-2 or Σ ∝ r-1. We also note that models with the lowest values of Σ tend to have surface density profiles independent of radius.
For a given DM halo mass and equal gas temperature, models with lower values of Σ have higher values of the Q parameter, as expected. It is worth noting that the lowest QT is often found a few hundred or even thousand parsecs away from the galactic center. This behavior can be understood by analyzing the radial dependence of the epicycle frequency ν = (4Ω2 + rdΩ2/dr)1/2. This quantity is independent of radius r in the inner parts r ≪ r0, where the DM halo and gas densities are nearly constant and Ω ≈ const. On the other hand, at r ≫ r0 the epicycle frequency declines with radius because the DM halo and gas densities also (as a rule) decline with radius. This implies that QT is nearly independent of r in the inner parts but may increase or decrease in the outer parts depending on the radial profile of the gas surface density Σ. For models with Σ nearly independent of radius, QT generally decreases at large radii (because ν also decreases but other quantities stay nearly constant), whereas for models showing a decline in Σ at large radii, the corresponding values of QT attain a minimum at some several hundred or thousand parsecs and increase on both sides.
It is also worth noting that the rotation curves of our model galaxies either steadily rise or flatten out only at large radii. This behavior qualitatively agrees with the observed rotation curves of DGs (see e.g. de Blok et al. 2008; Oh et al. 2008; Swaters et al. 2009, 2011).
The horizontal dotted lines in the left and middle columns of Fig. 2 mark the critical gas surface density for star formation Σc = 5 M⊙ pc2 and the critical Toomre parameter Qc = 2.0. We used these values to determine models that can allow for star formation, i.e., models for which both criteria Σ > Σc and QT < Qc are met at least in some parts of the galactic disk, and the gas mass  with number density greater than 1.0 cm-3 also exceeds a minimum value of 104 M⊙ as stipulated by the third SF condition. These “star-formation-allowed” models are highlighted with red color in Fig. 2.
For every model in Fig. 2, we calculated the total gas mass Mg contained within our computational domain, the latter having a cylindrical shape with radius of 8 kpc and height of 8 kpc on both sides from the midplane. We used Mg as a proxy for the total gas mass5, and estimated the possible missing gas mass using the surface density profiles in Fig. 2. For models with MDM = 1010 M⊙, Σ(r) ∝ r-2 and Mg(r) ∝ ln(r) at large radii, implying a small correction on the order of unity for a computational box with size three times greater than ours (24 × 24 kpc). For models with MDM ≤ 108 M⊙, Σ(r) ∝ r-1.1 and Mg(r) ∝ r0.9, implying a factor of 2.7 increase in the total gas mass. This means that our estimates are accurate to within a factor of unity for models with MDM ≳ 109 M⊙, while for models with smaller DM halos we may underestimate the total gas mass by up to a factor of 3.
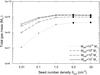 |
Fig. 3 Total gas masses Mg calculated for five models with different seed density values n0,0. The filled squares mark the models that are susceptible to star formation according to the adopted criteria. Lines of different style connect models with equal masses of the DM halo. |
The total gas masses Mg for every model are plotted in Fig. 3. The bottom axis shows the seed number density n0,0 for each model. Lines of different style connect models with the same mass of the DM halo (e.g., models with MDM = 109 M⊙ are connected with the dash-dotted line). We marked the star-formation-allowed models by filled squares.
Evidently DM halos can host steady-state gaseous disks with various masses, but not all gas configurations are prone to star formation. There exists a minimum gas mass  that a DM halo needs to accumulate to fulfill the star formation criteria. For instance, for a DM halo with mass 1010 M⊙ (dotted line) the corresponding minimum gas mass is 4.3 × 10⁸ M⊙, while for a DM halo with mass 108 M⊙ (dashed line) the corresponding minimum gas mass is 1.3 × 10⁹ M⊙. As one can see,
  depends on the mass of the DM halo and may increase as MDM decreases. The latter effect is not unexpected – a DM halo with smaller mass has a weaker gravitational potential and, as a consequence, a more massive gaseous disk is required to attain the critical density for star formation. The gas self-gravity here is a key factor, without which this effect will be absent.
5. Minimum gas mass for star formation vs. dark matter halo mass
In this section, we study in more detail the dependence of the minimum gas mass for star formation on the mass of the DM halo, as well as on other properties of galactic systems. We emphasize here that is the total gas mass of a galaxy in which star formation is allowed according to the adopted SF criteria and not the gas mass that fulfills the star formation criterion (18). The latter quantity is always smaller than because only part of the gas disk is characterized by ng > nc. We chose to concentrate on because we compared this quantity to the baryonic mass derived from the ΛCDM theory.
Throughout the paper we consider quasi-isothermal DM halos (if not specified otherwise) described by Eqs. (5)–(8). The top panel in Fig. 4 presents the –MDM relation for the four values of the DM halo mass (107 M⊙, 108 M⊙, 109 M⊙, and 1010 M⊙). In particular, the thick blue solid line shows the data for the spin parameter α = 0.9 and gas temperature Tg = 104 K (independent of the DM halo mass), while the thick blue dashed line represents and the same value of α6. The latter relation is normalized to Tg = 104 K for MDM = 1010 M⊙, which yields the following scaling law 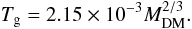 (19)The corresponding values of Tg are indicated in Fig. 4 for every pair of data (
 ). The adopted set of parameters (quasi-isothermal DM halo, α = 0.9, and gas temperature either dependent on or independent of MDM) is denoted hereafter as the reference model. The bottom panel in Fig. 4 also shows the ratio
  versus MDM.
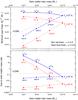 |
Fig. 4 Top. Minimum gas mass for star formation |

The dotted line in Fig. 4 presents the baryonic mass Mb for a given DM halo mass as expected from the ΛCDM theory and WMAP4 data (Spergel et al. 2003) with Ωb/Ωm = 0.17. If we treat Mb as an upper limit of the available gas mass, it becomes evident that galaxies with MDM ≤ 109 and Tg = 104 K require much more gas than available to achieve a state in which star formation is allowed. This statement applies to quasi-steady systems and may break down for galaxies that accumulate their gas mass reservoir via a series of violent mergers or if an external perturbation drives the system out of equilibrium and triggers star formation in some parts of the galaxy, as discussed below in Sect. 8.1.
An alternative solution is that galaxies can cool to sufficiently low temperatures to warrant a more compact and dense gas configuration. Figure 5 shows gas surface densities Σ (left column), Toomre Q parameters (middle column), and gas rotation velocities vφ (right column) for the same parameters as in Fig. 2 but for  as described by Eq. (19), with the corresponding gas temperatures indicated for every MDM in the right column. One can see that the gas surface density profiles are considerably steeper for cooler gas disks and are characterized by approximately the same power law r-2 in the outer regions. Furthermore, the transition radius from a near-constant surface density to the sloped one decreases with mass7, in contrast to models with the DM-mass-independent gas temperature Tg (Fig. 2).
The star formation criteria (16) and (17) are satisfied only in the inner parts of our model galaxies, with the size of the star formation region shrinking to a few tens of parsecs for models with MDM ≤ 108 M⊙. Moreover, the value of notably decreases for lower mass DM halos. These very compact starburst regions are not unusual in low-mass star-forming galaxies. For instance, the galaxy SBS 0335-052 has a star-forming radius of only ~20 pc (see e.g. Takeuchi et al. 2003).
As the blue dashed line in the top panel of Fig. 4 demonstrates, models with have much smaller than models with Tg = 104 K. Moreover, models with are characterized by  , meaning that these galaxies may have a sufficient gas reservoir to achieve a state in which SF is allowed. However, the required gas temperatures are quite low, especially for MDM ≤ 108 M⊙. Moreover, the obtained rotation curves (third column in Fig. 5) are much flatter for models with MDM ≤ 108 M⊙ than for their more massive counterparts. We conclude that models with can provide a better agreement with the ΛCDM predictions but at the cost of a worsening agreement with observations for the low DM mass models.
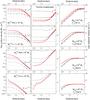 |
Fig. 5 Same as Fig. 2 for the gas temperature |
5.1. The effect of varying rotation support
Decreasing the amount of rotation leads to more compact and dense gas configurations as the pressure forces start to play an ever increasing role in the support against gravity. Therefore, one can expect that lowering the spin parameter would produce steady-state gaseous configurations with steeper gas surface density profiles (provided that the gas temperature is constant).
This effect is illustrated in Fig. 6, which shows the gas surface density distributions for models with α = 0.5 (solid lines) and α = 0.9 (dashed lines). For the sake of convenience, we compare only the star-formation-allowed models8 with the lowest value of . For α = 0.9, these models are marked by red solid lines in Figs. 2 and 5. Evidently, models with lower α are characterized by more compact gas disks with steeper density profiles at large radii. This effect takes place because the α = 0.5 models compensate for a weaker rotation support with steeper gas density (and pressure) gradients. As a result, these models also have smaller than the corresponding α = 0.9 models9.
Figure 4 illustrates the effect of a weaker rotation support against gravity. The thin red lines show the data for α = 0.5, the other parameters are identical to those of the reference model. Clearly, the minimum gas mass for star formation is substantially lower in galaxies with lower values of α. The effect is particularly strong for galaxies with  . Lowering the spin parameter even more to α = 0.25 yields only a factor of two decrease in at most. We point out that the minimum gas mass for star formation remains still much greater than the available baryonic mass Mb for galaxies with MDM ≤ 108 M⊙ and Tg = 104 K.
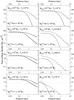 |
Fig. 6 Comparison of the gas surface density profiles for models with the spin parameter α = 0.5 (solid lines) and α = 0.9 (dashed lines). The DM halo mass MDM and the gas temperature Tg are indicated in every panel. The gas mass |
5.2. Variations in the DM halo form
As already mentioned, the mass and shape of DM halos in DGs are still very uncertain and the problem is highly debated in the literature. If the DM density at small galactocentric radii ϖ is approximated by a power law (ρDM ∝ ϖ − β), a value of β close to or slightly lower than one (i.e., cusps) is obtained in numerical simulations based on the ΛCDM theory (Navarro et al. 1997, 2010). On the other hand, observations suggest values of β close to zero, implying the presence of cores with near-constant DM density at small ϖ (de Blok et al. 2001; Spekkens et al. 2005). This unsolved mismatch between observations and models is commonly referred to as the “cusp-core problem”.
Our reference quasi-isothermal DM halos are cored DM profiles. In this section we estimate the effect that a cuspy DM halo advocated by Navarro et al. (1997) and described by Eqs. (10) − (12) may have on the values of . Figure 7 compares the minimum gas masses obtained in the reference model for the quasi-isothermal DM halo (blue lines) with those calculated for the NFW halo (red lines). Obviously, the difference is negligible for models with Tg = 104 K and is minimal for models with  . Therefore, the form of the DM halo is not expected to play a significant role in determining the minimum gas mass for star formation as long as the total mass of the DM halo is the same.
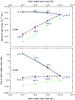 |
Fig. 7 Top. Minimum gas mass for star formation |
5.3. The effect of a pre-existing stellar disk
So far we have considered model galaxies that consist of a gaseous disk and DM halo. However, real star-forming galaxies in the Local Universe almost always have a pre-existing stellar disk, which may affect the form of the gaseous disk via the stellar gravitational potential. To explore the extent of this effect, we assumed that our galaxies in the reference model have a burst of star formation that turns 10% of the gas content into stars. Star formation takes place in those parts of the gas disk that obey the three criteria for star formation Σ > Σc = 5 M⊙ pc-2 and QT < Qcr = 2.0. We then constructed a new equilibrium gas disk in the combined gravitational potential of gas, stars, and DM halo. The spin parameter of the stellar disk was assumed to be equal to that of the gaseous disk. This assumption is justified if the gas sound speed is comparable to the stellar velocity dispersion, which is often true for DGs.
The black lines in Fig. 7 show the minimum gas mass  for new models that take into account a recent burst of star formation. Evidently, the stellar disk has little effect on the value of irrespective of the DM halo mass (the black line is almost indistinguishable from the blue line that shows the reference model). This is explained by the fact that the mass of the stellar disk Ms is only a small addition to the total mass budget. For instance, in models with MDM = 1010 M⊙,
  and Ms = 0.0028 MDM. In models with MDM = 107 M⊙,
  and Ms = 4.1 MDM (in both cases, Tg = 104 K). Unless many repetitive bursts of star formation take place with the integrated star formation efficiency considerably exceeding 0.1 (leading to a significant increase in the star-to-gas mass ratio), we do not expect the gravitational potential of the stellar disk to affect our results. However, we note that the stellar feedback may drive the gas disk out of equilibrium, thus affecting our estimates of .
5.4. Galaxies at higher redshifts
In this section, we study the dependence of on the redshift of galaxy formation zgf. Dark matter halos of the same mass at higher redshifts are more compact and one may expect that this could affect the shape of the gas disk and hence the value of . We modify Eqs. (6)–(8) to include the dependence on zgf (e.g. Fujita et al. 2003) 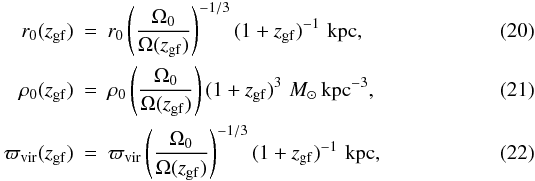 where Ω0 ≡ Ω(zgf = 0) and Ω(zgf) is defined as
 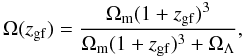 (23)with Ωm and ΩΛ set to 0.24 and 0.76, respectively.
The green lines in the upper panel of Fig. 7 show the minimum gas mass for star formation as a function of MDM in the reference model but with zgf = 2.0. In compliance with the downsizing, low-mass galaxies have a median redshift of star formation lower than large objects and a value of zgf = 2 well represents an average galaxy formation redshift for DGs (see e.g. Thomas et al. 2005; Cattaneo et al. 2011). We also note that zgf = 2.0 yields DM halos that are roughly a factor of two more compact and a factor of seven denser.
Clearly, the effect of a higher redshift is quite pronounced for models with (shown by the green dashed lines), producing values of almost a factor of 10 lower than in the reference model (blue dashed lines). However, for models with Tg = 104 K, the resulting values of quickly approach those of the zgf = 0 models (blue lines) for low values of MDM.
The lowering of can be understood if we compare the radial density profiles of the DM halos of equal mass at different redshifts. The right-hand panel in Fig. 8 presents the volume density ρqis of the quasi-isothermal DM halo as a function of radial distance ϖ for the reference model (zgf = 0, dashed lines) and the zgf = 2.0 model (solid lines). The corresponding masses of the DM halos are indicated in each panel. One can see that the DM halos at zgf = 2.0 are characterized by higher densities than their zgf = 0 counterparts. This causes gaseous disks at higher redshifts to assume steeper density profiles to compensate an increasing gravity force of the DM halo. This effect is illustrated in the left-hand panel of Fig. 8, which compares the gas surface density profiles in the star-formation-allowed models at zgf = 0 (dashed lines) and the zgf = 2.0 model (solid lines). All other model parameters are those of the reference model and the gas temperature is indicated in each panel. Indeed, the zgf = 2.0 models are characterized by gaseous disks that are significantly more compact than their zgf = 0 counterparts, which results in systematically lower values of .
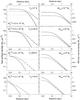 |
Fig. 8 Left column. Comparison of the gas surface density in the reference model (dashed lines) with that of the zgf = 2.0 model (solid lines). The dotted line marks the critical surface density for star formation Σc = 5 M⊙ pc-2. Gas temperature is indicated in every panel and the DM halo mass is shown in the corresponding panels on the right. The gas mass |
6. Reconciling the gas-to-DM ratio with the ΛCDM predictions
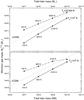 |
Fig. 9 Top. Effect of changing the zero-point of the |
Figures 4 and 7 demonstrate that the minimum gas mass for star formation may greatly exceed the DM halo mass (and, of course, the gas-to-DM mass ratio can exceed the suggested cosmological value of 0.17) for models with MDM ≤ 109 M⊙ and Tg = 104 K. This apparent contradiction between the baryon-to-DM ratios deduced by our models and the cosmologically inferred one should not be a major source of concern at the present stage. Indeed, we know already that some objects in the Universe do have baryon-to-DM ratios higher than 0.17 (e.g., globular clusters, high-velocity clouds, and probably also dEs and dwarf irregular galaxies, see the introduction). At the same time, Figs. 4 and 7 show that models in which (as suggested by the virial relations) neatly reproduce a constant gas-to-DM mass ratio, although below the cosmological value of 0.17.
In this section, we explore whether the cosmological value can be reproduced by our models with either a different choice of the zero point of the Tg–MDM relation or by introducing some non-thermal support against gravity in Eq. (1). To explore the first possibility, we chose the following scaling law between the gas temperature and the DM halo mass 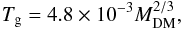 (24)which yields gas temperatures roughly higher by about a factor of two than Eq. (19), i.e., Tg = 2.23 × 10⁴ K for MDM = 1010 M⊙, Tg = 0.48 × 10⁴ K for MDM = 109 M⊙, Tg = 1.03 × 10³ K for MDM = 108 M⊙, and Tg = 223 K for MDM = 107 M⊙.
The top panel in Fig. 9 shows the minimum gas mass for star formation as a function of the DM halo mass MDM. The dashed line presents the data for the new scaling law described by Eq. (24), while the solid line represents the old scaling given by Eq. (19). As one can see, the new scaling law yields somewhat higher gas masses than a cosmological value and the slope of the model –MDM relation is somewhat shallower than the cosmological one (dotted line). On the other hand, the old scaling law yields that are somewhat lower than the cosmological values. This means that varying the zero point of the  relation, one can in principle achieve a good agreement with the ΛCDM theory.
To explore the second possibility, we assumed that our model gas disk has a non-thermal support against gravity in the form of turbulence and magnetic pressure. For the sake of simplicity, we assumed equipartition between the gas kinetic pressure P and the two sources of non-thermal support (but see Cox 2005), which yields the effective gas pressure  (which would correspond to an effective velocity dispersion
  ). The dash-dotted line in the bottom panel of Fig. 9 presents the –MDM relation for the case with the non-thermal support. Evidently the corresponding gas masses increase considerably, in particular for models with MDM ≤ 109 M⊙. This is because by introducing the non-thermal support we effectively increase the gas pressure and the corresponding gas surface density profiles become shallower as compared to those without non-thermal support. This results in an overall increase in the gas mass of a steady-state gaseous configuration. Figure 9 also suggests that by varying the magnitude of the non-thermal support one can achieve a good agreement with the cosmological mass of baryons given by the dotted line, particularly for galaxies with MDM ≤ 1010 M⊙.
7. Implications for the evolution of dwarf galaxies
In this work, we have presented numerical solutions for equilibrium configurations of model galaxies consisting of gas, stars and a DM halo in the combined gravitational potential of each of these components. The properties of these equilibrium configurations and, in particular, the minimum gas mass needed to achieve a state that allows star formation have been considered in detail.
In future more detailed works we will be using our derived equilibrium configurations as initial setups of galaxy models for which we will numerically study the detailed chemical and dynamical evolution, and also the effect of SF feedback. The interest in simulating the evolution of DGs is steadily growing in the past years. The reason is that ΛCDM theories of structure formation predict that dwarf galaxy-sized objects are the first virialized structures in the Universe. Moreover, the study of star formation and feedback in DGs is in many respects much simpler than in large spiral galaxies. Although studies of DGs in a cosmological context are more numerous and detailed than in the past (e.g. Kazantzidis et al. 2011; Sales et al. 2011; Pilkington et al. 2011; Governato et al. 2010), they still do not have sufficient spatial resolution to analyze in detail the internal evolutionary processes. A lot in resolution can be gained by zooming in and re-simulating small chunks of a large cosmological box (Martig et al. 2009; Sawala et al. 2011), but still the best way to accurately simulate a dwarf galaxy is by numerically studying it as a single isolated entity (Schroyen et al. 2011; Scannapieco & Brüggen 2010; Revaz et al. 2009) although in reality they are subject to various environmental effects.
Although a quantitative comparison between our predictions and observations in DGs requires taking into account the feedback from star formation, our modeling can yet give us some insight in to the expected evolution of DGs. First, we note that for some models (especially the low-mass ones with T = 104 K, see Fig. 2, bottom row of panels) star formation is not expected to occur in the center of the galaxy, but only in a shell with inner radius between ≃100 pc and ≃1.0 kpc.
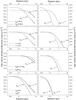 |
Fig. 10 Comparison of the gas volume density profiles along the r-axis (left column) and z-axis (right column). In particular, models in the top row are characterized by different gas temperatures Tg (as indicated), the second top row by different spin parameters α, the third top row by different effective gas dispersions σeff, and the bottom row by different redshift for galaxy formation zgf. All other parameters for every model are the same (see text for more details). |
Second, the evolution of supernova-driven shells is known to depend on the gas density distribution, which in turn is sensitive to the initial conditions in a dwarf galaxy. For instance, the Rayleigh-Taylor instability in the shell grows faster for steeper gas density profiles. Figure 10 compares the gas volume density distributions ρg in star-formation-allowed models with different Tg, α, σeff, and zgf. In particular, the left/right columns show the radial profiles of ρg taken along the r-/z-axes. For the sake of conciseness, we considered only models with MDM = 109 M⊙, models with other DM halo masses show a similar behavior. Models in the top row are characterized by α = 0.9, σeff = σg, and zgf = 0 (but different Tg as indicated in the figure), models in the second top row by Tg = 104 K, σeff = σg, and zgf = 0 (but different α), models in the third row by Tg = 104 K, α = 0.9, and zgf = 0 (but different σeff), and models in the bottom row by Tg = 2150 K, α = 0.9, σeff = σg (but different zgf).
Obviously, taking a lower gas temperature Tg or spin parameter results in equilibrium gas disks with a steeper tail of the gas volume density distribution. A similar effect is observed for models with a higher redshift for galaxy formation zgf. On the other hand, models with and without non-thermal support have similar radial profiles of ρg. For every model considered, the vertical profiles of ρg are steeper than those taken along the horizontal axis, suggesting a blow-out effect along the rotational axis. The variety of possible model realizations implies that the evolution of DGs after the onset of star formation may follow different pathways depending on the initial conditions in the gas disk, even for the same DM halo mass.
8. Model caveats
8.1. Steady-state gaseous disks
A steady-state model is a first-order approximation to DGs galaxies. Various effect such as stellar feedback, non-axysimmetric density waves, and, in particular, external perturbations may drive DGs out of equilibrium. These phenomena can trigger star formation in otherwise quiescent gas disks and affect our derived values of . To estimate the possible magnitude of these effects, we focus on perturbations with the conservation of the total gas mass10 and refer to star-formation-inactive models plotted in Fig. 2 by black lines. Clearly, positive perturbations in Σ by a factor of 5–100 are needed to drive these models to the star formation threshold.
If perturbations of this amplitude are possible, the critical gas mass required for star formation may be significantly lower. Indeed, as Fig. 3 demonstrates, the total gas mass Mg of an equilibrium configuration declines with decreasing n0,0. The filled squares mark the star-formation-allowed models, while the open circles correspond to the star-formation-inactive ones. If the n0,0 = 0.01 cm-3 models can be pushed to the star formation threshold, then the minimum mass for star formation may be as low as 107 M⊙ for the MDM = 1010 M⊙ model. This corresponds to almost a factor of 40 decrease in the value of as compared to the star-formation-allowed model with n0,0 = 5 cm-3. We note, however, this effect becomes considerably less pronounced for models with smaller DM halo masses. For instance, the corresponding decrease in for the MDM = 107 M⊙ model is only a factor of 2.5. We conclude that high-amplitude density perturbations of the equilibrium state can significantly affect our estimates of only for models with MDM ≳ 109 M⊙ but are of fairly low significance for models with MDM ≲ 108 M⊙.
8.2. Multi-phase interstellar medium
In this study we have neglected the fact that the interstellar medium consists of various phases with usually different temperatures and considered a single-phase medium with some typical temperature Tg. Although cores of molecular clouds (where star formation occurs) have temperatures much lower than 104 K, this value must be seen as a mass-weighted mean temperature within each computational cell (which has a size much larger than the cores of molecular clouds). Indeed, the hot (~106 K) and cold (~a few × 10 K) gas phases usually amount to about 1% and 10% of the total gas mass reservoir, respectively (for the SF efficiency of ~10%), meaning that the mean temperature is mostly determined by the warm gas phase. In this sense, Tg = 104 K represents sort of an upper limit because it is impossible that a computational cell hosting (star-forming) regions with temperatures of few tens of K can have an average temperature significantly above 104 K. We note that mean temperatures lower than 104 K are, of course, possible, provided efficient cooling and low SF feedback.
One may argue that even though some models for Tg = 104 K may have difficulty to achieve critical densities for star formation, the differentiation into a multi-phase medium may eventually push a local region to star formation, and that may trigger a chain reaction through the bulk of a galaxy. To account for this possibility, we have adopted the empirical star formation threshold by Kennicutt (2008). While the Toomre Q parameter criterion is based on the gravitational properties of a single-phase medium, the Kennicutt criterion is based on observations of real multi-phase galaxies and hence implicitly takes into account the possibility of phase differentiation discussed above. In a comprehensive review, Hensler (2008) has discussed the advantages of a multi-phase treatment of the ISM in star-forming galaxy disks and emphasized the limitations of single gas-phase description.
8.3. Star formation criteria
In this paper, we have adopted three SF criteria, which are based on theoretical arguments, i.e., the Toomre gravitational stability criterion (16), and empirical evidence, i.e., the Kennicutt-Schmidt law (17). These SF criteria are not without limitations, and observations suggest that SF can occur even in the Toomre-stable regions with QT ≳ Qc, e.g., near the galactic center where the gravitational stability may be determined by the rate of shear rather than by the magnitude of epicycle motions (Vorobyov 2003). Moreover, a few galaxies in Kennicutt’s (2008) sample harbor SF below the adopted gas density threshold of Σc = 5 M⊙ pc-2. At the lower end of the KS correlation the scatter of measurements also widens, because the SF rate fluctuates more stochastically and e.g. starbursting DGs are systematically located above the relation (see e.g. Hensler 2012). In addition, it is well documented that the KS relation is tighter when the SF rate is correlated with the molecular hydrogen H2 (Kennicutt et al. 2007; Bigiel et al. 2008).
Nevertheless, we can use the same arguments as in Sect. 8.1 to show that a variation of factor of ten in the adopted value of Σc can significantly affect our estimates of only in models with the DM halo mass MDM ≳ 109 M⊙ and the effect of uncertainty in Σc is diminishing for DM halos with smaller mass11. The value of nc is more uncertain and depends largely on the numerical resolution. Our adopted value of 1.0 cm-3 complies with most numerical studies on galactic star formation, and varying this value by a factor of 10 can produce variations of only a factor of several in , owing to a fairly week dependence of the total gas mass on n0,0 (see Fig. 3).
It is worth pointing out that the Kennicutt-Schmidt relation (17) is based on Hα measurements, which only reveal the presence of massive stars in the SF regions. Recently, mostly thanks to the GALEX satellite, measurements of UV fluxes became available for dwarf galaxies. It turned out that below ~10-2 M⊙ yr-1, the SF rate determined by the Hα measurements largely underestimates that based on UV fluxes (Lee et al. 2009). If the IMF in DGs is top-light (i.e. steeper than the Salpeter slope and with a low upper-mass cutoff), Hα fluxes can be very low even though SF is active (Pflamm-Altenburg et al. 2009). This can affect the threshold value for star formation Σc in Eq. (17).
9. Conclusions
We have constructed a series of rotating equilibrium galaxies consisting of gas, stars, and a fixed DM halo, with masses of the latter MDM in the range of 107 − 1010 M⊙. Our models differ from most previous studies in that we self-consistently took into account self-gravity of the gas component. Variations in the gas temperature, DM halo shape, rotation and non-thermal support, and also in the redshift for galaxy formation have been considered. We applied contemporary star formation criteria to the resulting equilibrium configurations to estimate the feasibility of large-scale star formation in our models. For the star formation criteria, we choose the Toomre gravitational stability criterion with the Toomre parameter smaller than a critical value of Qc = 2.0 and the Kennicutt-Schmidt law with the gas surface density higher than a critical value of Σcrit = 5.0 M⊙ pc-2. These criteria need to be satisfied simultaneously at least in some parts of the gas disk for the model to be marked as star-formation-allowed (SFA). In addition, we require that the gas mass with number density higher than  cm-3 exceed 104 M⊙ to allow for an SF event of non-negligible magnitude.
We compared gas masses of the SFA models with the baryonic mass Mb derived from the ΛCDM theory and WMAP4 data, for which the ratio of the baryon-to-DM mass is 0.17. We found the following:
-
For a given DM halo mass one needs a minimum gas mass
to achieve a state in which star formation is allowed. The value of depends crucially on the gas temperature Tg, the gas spin parameter α, the amount of nonthermal support in the gas disk, and, to a somewhat lesser extent, on the redshift for galaxy formation zgf. On the other hand, is quite insensitive to the form of the DM halo and to the pre-existing stellar disk, provided that the past SF efficiency does not exceed 0.1 considerably. -
As a rule,
is lower for galaxies with lower α and Tg and is higher for objects with stronger non-thermal support σeff. In addition, may be smaller for objects that form at higher redshifts. -
Depending on the gas temperature Tg, gas spin parameter α, gas effective velocity dispersion σeff, and the redshift for galaxy formation zgf, the SFA models may have
that is either higher or lower than Mb. Models with MDM ≳ 109 M⊙ are usually characterized by  , implying that star formation in these galaxies is a natural outcome of their evolution. On the other hand, models with MDM ≲ 109 M⊙ are often characterized by
  , implying that they need much more gas than available according to the ΛCDM theory to achieve a state in which star formation is allowed.
 -
A good agreement of our derived
with Mb can be achieved if the spatially uniform gas temperature follows the virial relation with a proper choice of the zero point or some added non-thermal support. However, the required temperatures for objects with MDM ≲ 108 M⊙ are quite low ( ≤ a few hundred Kelvin) and the rotation curves only poorly agree with those observed in DGs. -
SFA models with MDM ≲ 108 M⊙ and Tg ≳ a few × 104 K have
that greatly exceed both Mb and MDM, implying that some star-forming DGs may be baryon-dominated.
Our modeling suggests that a star-formation-allowed state is more difficult to achieve in DM halos with mass ≲ 109 M⊙ than in their upper-mass counterparts, because the required gas mass may be much greater than that available according to the ΛCDM theory. This implies that there may be a critical DM halo mass below which the likelihood of star formation and hence the total stellar mass drops substantially. Interestingly enough, the stellar versus DM halo mass relation recently derived by Guo et al. (2010) using the SDSS survey and millennium simulations implies the existence of such a threshold value. On the other hand, DGs with the gas plus stellar mass greater than that of the DM halo are not unheard of and recent observations of the mass-to-light ratios in Virgo Cluster dwarf ellipticals by Toloba et al. (2011) and in gas-rich DGs by Swaters et al. (2011) point to the existence of such objects. These observations, along with our results, suggest that the ΛCDM paradigm is not universal and significant deviations from the corresponding Mb–MDM trend are possible.
Our study outlines the importance of gas self-gravity (neglected in practically all hydrodynamical studies of isolated DGs) in building equilibrium galaxies. The main argument in favor of neglecting the gas self-gravity has been based on the assumption that the total gas mass is always much smaller than that of the DM halo. As we have demonstrated, this assumption may be quite unfounded, particularly for low-mass DM halos with MDM ≤ 108 M⊙. The reason is that the baryonic matter has to dominate the dark matter in objects with low DM halo masses to achieve the Kennicutt-Schmidt SF criterion. We emphasize that our results are strictly applicable to DM halos that have accumulated their mass reservoir quasi-statically and our results remain to be justified for objects that have undergone a series of violent mergers. At the same time, our main conclusions are not affected by moderate perturbations in a quasi-equilibrium state and reasonable variations in the adopted values of Σcrit and Qc.
Online material
Appendix A: Solving for the steady-state equations
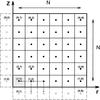 |
Fig. A.1 Computational domain in the (r,z) plane showing active and ghost grid zones with solid and dashed lines, respectively. The zone centers are marked with filled/open circles for active/ghost zones. The arrows indicate the backward finite-difference scheme used to discretize spatial derivatives. The innermost grid cell highlighted with a backslash palette refers to the seed value of the gas surface density n0,0. |
Figure A.1 shows the N × N computational mesh employed to discretize the steady-state Eqs. (3) and (4). The active zones are outlined with the solid lines, while the two rows of ghost zones (representing the reflecting boundary conditions along the z- and r-axes) are marked with the dashed lines. The active/ghost zone centers are denoted with filled/open circles.
A class of problems that does not require the knowledge of the gas density at the outer z and r boundaries (i.e., at N + 1 grid zones) can be solved using the following procedure. We use a first-order backward difference scheme (schematically shown by the arrows) to obtain a finite-difference representation of Eqs. (3) and (4) for the case with a spatially uniform σg![Mathematical equation: \appendix \setcounter{section}{1} \begin{eqnarray} {\ln\rho^{(i,j)}_{\rm g} -\ln\rho_{\rm g}^{(i,j-1)} \over \triangle r_j} &=& {1 \over \sigma^2_{\rm g}} \left[{ v_{\rm g}^{2,(i,j-1/2)} \over r_{j-1/2} } + g_{{\rm g},r}^{(i,j-1/2)} + g_{{\rm h},r}^{(i,j-1/2)} \right] \nonumber \\ {\ln\rho_{\rm g}^{(i,j)} -\ln\rho_{\rm g}^{(i-1,j)} \over \triangle z_i} &=& {1 \over \sigma^{2}_{\rm g}}\left[ g_{{\rm g},z}^{(i-1/2,j)} + g_{{\rm h},z}^{(i-1/2,j)} \right], \end{eqnarray}](/articles/aa/full_html/2012/07/aa19113-12/aa19113-12-eq243.png) (A.1)where the indices i and j correspond to the z and r coordinate directions, respectively. We note that densities are defined at the zone centers while gravitational accelerations and velocities are defined at the corresponding zone interfaces. In order for this difference scheme to work, one needs to define the gas density at the ghost zones (which equal those at the nearest active zones) and also the gas density at the innermost active zone (1,1) denoted in the paper as the seed density n0,0. The corresponding zone is highlighted with the backslash palette in Fig. A.1.
(A.1)where the indices i and j correspond to the z and r coordinate directions, respectively. We note that densities are defined at the zone centers while gravitational accelerations and velocities are defined at the corresponding zone interfaces. In order for this difference scheme to work, one needs to define the gas density at the ghost zones (which equal those at the nearest active zones) and also the gas density at the innermost active zone (1,1) denoted in the paper as the seed density n0,0. The corresponding zone is highlighted with the backslash palette in Fig. A.1.
With this choice of the discretization scheme and boundary conditions, one can notice that  and
and  are known for every value of
  and the latter can be found by a fast-forward substitution algorithm if one proceeds from left to right along the r-direction, starting from the bottom layer of zones and advancing one horizontal layer after another in the direction of increasing z.
Appendix B: Testing equilibrium configurations
An important reliability check on the solution procedure is to test how our equilibrium configurations can be handled by time-dependent numerical hydrodynamics codes. If our steady-state models are correct, a galaxy should stay in rotational equilibrium for at least 500 Myr, a typical time of interest when simulating the effect of supernova explosions in DGs.
To perform such a test, we used our time-dependent numerical hydrodynamics code employed earlier to study the effect of SN explosions in DGs in the local Universe and and high redshifts (Vorobyov et al. 2004; Vorobyov & Basu 2005; Vasiliev et al. 2008). We intentionally turned off cooling and heating to avoid the system drifting out of equilibrium due to thermal effects. For the test, we used the reference model with MDM = 109 M⊙, α = 0.9, Tg = 104 K, and n0,0 = 5.0 cm-3. The gas surface density, Q parameter, and velocity profiles of this model are shown by the red solid lines in the second top row of Fig. 2.
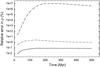 |
Fig. B.1 Maximum and mean relative errors (dashed and solid lines, respectively) in the gas volume density (top) as functions of time t for the reference test model described in Appendix B. The errors are calculated relative to the initial equilibrium configuration at t = 0 Myr. The dash-dotted lines show the relative errors in the absence of gas self-gravity. |
Figure B.1 shows the mean relative error (solid line) and the maximum relative error (dashed line) in the gas volume density ρg (top) as a function of time t in our test model. The relative errors (in per cent) are calculated at every grid cell as12 (B.1)and demonstrate the degree to which our equilibrium is held by the code during the time evolution. The mean relative errors
  are calculated by averaging the individual errors △ ρg,i,j over the entire computational grid. As one can see, the mean relative errors never exceed 0.1%, meaning the equilibrium is well preserved globally. The maximum relative error never exceeds 3% and is kept below 1% during most of the evolution. We note the maximum errors occur in dynamically unimportant regions near the axes at large ϖ. The gas temperature shows essentially the same behavior. This test convincingly proves the robustness and reliability of our solution procedure.
To demonstrate the importance of gas self-gravity and to perform the final check on our self-gravitating equilibrium configurations, we artificially turned off the gas self-gravity in our time-dependent numerical hydrodynamics code. The dash-dotted lines in Fig. B.1 present the resulting mean relative error. Obviously, neglecting the gas self-gravity results in a complete destruction of the equilibrium state, with the mean relative errors exceeding 106 for the gas volume density!
We note that Mac Low & Ferrara (1999) have a misprint in their equations that has been corrected in Silich & Tenorio-Tagle (2001).
Still, there will be some support from gas pressure gradients because circular velocity is not an exact solution of the steady-state Eq. (1) with P ≠ 0.
As mentioned in the introduction, it is very likely that the gas vertical scale height naturally increases outward, producing flaring, but the vertically integrated gas volume density (i.e., surface density) decreases outward.
In practice, we calculate |gh,r(z = 0)| and |gg,r(z = 0)| in the first layer of computational cells that lie directly above the midplane.
We cannot extend our computational boundaries to a distance much greater than 8 kpc because of the need for high spatial resolution to resolve the inner density plateau.
We recall that in all models the gas temperature is spatially uniform but its value may or may not depend on MDM.
Diminishing pressure support against gravity in models with lower Tg is compensated for by an increase in the gas density slope.
Strictly speaking, the MDM = 107 M⊙ and Tg = 102 K case has no star-formation-allowed models since the third criterion, i.e.,  is not fulfilled even for the highest n0,0 model. We relaxed this requirement in this particular case because the other two SF criteria are nevertheless satisfied.
We note that some of the α = 0.5 models have higher gas densities in the innermost regions, which is the result of the fairly coarse grid of models considered in the paper. Nevertheless, the size of this region is quite small (~0.2 kpc) and most of the gas mass is still concentrated at large radii.
Perturbations without conservation of the total mass, such as mergers or ram pressure stripping, can obviously affect our conclusions by changing the total available gas mass budget.
Note that Qc allows for a smaller variation on the order of unity.
An extended definition of the relative error that takes into account a situation where the gas density declines with time, and is thus normalized to the current value of ρg(t) rather than to the initial one ρg(0), yields very similar results.
Acknowledgments
The authors gratefully acknowledge the referee for an insightful report that helped to considerably improve the manuscript. E.V. thanks a Lise Meitner Fellowship (Austrian Science Fund FWF), project number M 1255-N16 for financial support. Numerical simulations were performed on the Atlantic Computational Excellence Network (ACEnet) and on the Shared Hierarchical Academic Research Computing Network (SHARCNET).
References
- Banerjee, A., Jog, C. J., Brinks, E., & Bagetakos, I. 2011, MNRAS, 415, 687 [NASA ADS] [CrossRef] [Google Scholar]
- Barnabé, M., Ciotti, L., Fraternali, F., & Sancisi, R. 2009, A&A, 446, 61 [Google Scholar]
- Bigiel, F., Leroy, A., Walter, F., et al. 2008, Astron. J., 136, 2846 [NASA ADS] [CrossRef] [Google Scholar]
- Black, D. C., & Bodenheimer, P. 1975, ApJ, 199, 619 [NASA ADS] [CrossRef] [Google Scholar]
- Bodenheimer, P., & Ostriker, J. P. 1973, ApJ, 180, 159 [NASA ADS] [CrossRef] [Google Scholar]
- Brinks, E., & Burton, W. B. 1984, A&A, 141, 195 [NASA ADS] [Google Scholar]
- Burkert, A. 1995, ApJ, 447, L25 [NASA ADS] [CrossRef] [Google Scholar]
- Carignan, C., & Beaulieu, S. 1989, ApJ, 347, 760 [NASA ADS] [CrossRef] [Google Scholar]
- Cattaneo, A., Mamon, G. A., Warnick, K., & Knebe, A. 2011, A&A, 533, A5 [NASA ADS] [CrossRef] [EDP Sciences] [Google Scholar]
- Chandrasekhar, S. 1969, Ellipsoidal figures of equilibrium (Yale University Press) [Google Scholar]
- Cox, D. P. 2005, ARA&A, 43, 377 [Google Scholar]
- de Blok, W. J. G., McGaugh, S. S., Bosma, A., & Rubin, V. C. 2001, ApJ, 552, L23 [NASA ADS] [CrossRef] [Google Scholar]
- de Blok, W. J. G., Walter, F., Brinks, E., et al. 2008, AJ, 136, 2648 [NASA ADS] [CrossRef] [Google Scholar]
- D’Ercole, A., & Brighenti, F. 1999, MNRAS, 309, 941 [NASA ADS] [CrossRef] [Google Scholar]
- Dong, H., Calzetti, D., Regan, M., et al. 2008, AJ, 136, 497 [Google Scholar]
- Elmegreen, B. 1997, in Starburst Activity in Galaxies, eds. J. Franco, R. Terlevich, & A. Serrano, Rev. Mex. Astron. Astrophys. Conf. Ser., 6, 165 [Google Scholar]
- Fujita, A., Martin, C. L., Mac Low, M.-M., & Abel, T. 2003, ApJ, 599, 50 [NASA ADS] [CrossRef] [Google Scholar]
- Governato, F., Brook, C., Mayer, L., et al. 2010, Nature, 463, 203 [NASA ADS] [CrossRef] [PubMed] [Google Scholar]
- Guo, Q., White, S., Li, C., & Boylan-Kolchin, M. 2010, MNRAS, 404, 1111 [NASA ADS] [Google Scholar]
- Harfst, S., Theis, C., & Hensler, G. 2006, A&A, 449, 509 [NASA ADS] [CrossRef] [EDP Sciences] [Google Scholar]
- Hensler, G. 2008, Proc. IAU Symp. 254, eds. J. Andersen, J. Bland-Hawthorn, & B. Nordstroem (Cambridge Univ. Press), 269 [Google Scholar]
- Hensler, G. 2012, Dwarf Galaxies Keys to Galaxy Formation and Evolution, at JENAM 2010 in Lisbon, eds. P. Papaderos, S. Recchi, & G. Hensler (Springer Publ.), Proc. Symp. 3, in press [Google Scholar]
- Kalberla, P. M. W., & Kerp, J. 2009, ARA&A, 47, 27 [NASA ADS] [CrossRef] [Google Scholar]
- Kazantzidis, S., Łokas, E. L., Mayer, L., Knebe, A., & Klimentowski, J. 2011, ApJ, 740, L24 [NASA ADS] [CrossRef] [Google Scholar]
- Kennicutt, R. C. 1998, ApJ, 498, 541 [NASA ADS] [CrossRef] [Google Scholar]
- Kennicutt, R. C. 2008, in Pathways Through an Eclectic Universe, ASP Conf. Ser., 390, 149 [NASA ADS] [Google Scholar]
- Kennicutt, R. C., Calzetti, D., & Walter, F. 2007, ApJ, 671, 333 [NASA ADS] [CrossRef] [Google Scholar]
- Kent, S. M., Dame, T. M., & Fazio, G. 1991, ApJ, 378, 131 [NASA ADS] [CrossRef] [Google Scholar]
- Kim, W.-T., & Ostriker, E. 2001, ApJ, 559, 70 [NASA ADS] [CrossRef] [Google Scholar]
- Kroupa, P., Famaey, B., de Boer, K. S., et al. 2010, A&A, 523, A32 [NASA ADS] [CrossRef] [EDP Sciences] [Google Scholar]
- Lebovitz, N. R. 1967, ARA&A, 5, 465 [NASA ADS] [CrossRef] [Google Scholar]
- Lee, J. C., Gil de Paz, A., Tremonti, C., et al. 2009, ApJ, 706, 599 [NASA ADS] [CrossRef] [Google Scholar]
- Leroy, A. K., Walter, F., Brinks, E., et al. 2008, AJ, 136, 2782 [NASA ADS] [CrossRef] [Google Scholar]
- Lindblom, L. 1992, Roy. Soc. London Philos. Trans. Ser. A, 340, 353 [NASA ADS] [CrossRef] [Google Scholar]
- Mac Low, M.-M., & Ferrara, A. 1999, ApJ, 513, 142 [NASA ADS] [CrossRef] [Google Scholar]
- Marcolini, A., Brighenti, F., & D’Ercole, A. 2003, MNRAS, 345, 1329 [NASA ADS] [CrossRef] [Google Scholar]
- Martig, M., Bournaud, F., Teyssier, R., & Dekel, A. 2009, ApJ, 707, 250 [NASA ADS] [CrossRef] [Google Scholar]
- Narayan, C. A., & Jog, C. J. 2002, A&A, 394, 89 [NASA ADS] [CrossRef] [EDP Sciences] [Google Scholar]
- Navarro, J. F., Frenk, C. S., & White, S. D. M. 1997, ApJ, 490, 493 [NASA ADS] [CrossRef] [Google Scholar]
- Navarro, J. F., Ludlow, A., Springel, V., et al. 2010, MNRAS, 402, 21 [NASA ADS] [CrossRef] [Google Scholar]
- Neto, A. F., Gao, L., Bett, P., et al. 2007, MNRAS, 381, 1450 [NASA ADS] [CrossRef] [Google Scholar]
- O’Brien, J. C., Freeman, K. C., & van der Kruit, P. C. 2010, A&A, 515, A62 [NASA ADS] [CrossRef] [EDP Sciences] [Google Scholar]
- Oh, S.-H., de Blok, W. J. G., Walter, F., Brinks, E., & Kennicutt, R. C. 2008, AJ, 136, 2761 [NASA ADS] [CrossRef] [Google Scholar]
- Papaderos, P., Loose, H.-H., Fricke, K. J., & Thuan, T. X. 1996, A&A, 314, 59 [NASA ADS] [Google Scholar]
- Papaderos, P., Guseva, N. G., Izotov, Y. I., & Fricke, K. J. 2008, A&A, 491, 113 [NASA ADS] [CrossRef] [EDP Sciences] [Google Scholar]
- Pflamm-Altenburg, J., Weidner, C., & Kroupa, P. 2009, MNRAS, 395, 394 [NASA ADS] [CrossRef] [Google Scholar]
- Pilkington, K., Gibson, B. K., Calura, F., et al. 2011, MNRAS, 417, 2891 [NASA ADS] [CrossRef] [Google Scholar]
- Polyachenko, V. L., Polyachenko, E. V., & Strelnikov, A. V. 1997, Astron. Z., 23, 551 (translated Astron. Lett. 23, 483) [Google Scholar]
- Recchi, S., Matteucci, F., & D’Ercole, A. 2001, MNRAS, 322, 800 [NASA ADS] [CrossRef] [Google Scholar]
- Revaz, Y., Jablonka, P., Sawala, T., et al. 2009, A&A, 501, 189 [NASA ADS] [CrossRef] [EDP Sciences] [Google Scholar]
- Roychowdhury, S., Chenngulat, J. N., Begum, A., & Karachentsev, I. D. 2009, MNRAS, 397, 1435 [NASA ADS] [CrossRef] [Google Scholar]
- Sales, L. V., Navarro, J. F., Cooper, A. P., et al. 2011, MNRAS, 418, 648 [NASA ADS] [CrossRef] [Google Scholar]
- Salucci, P., & Burkert, A. 2000, ApJ, 537, L9 [NASA ADS] [CrossRef] [Google Scholar]
- Sancisi, R., & Allen, R. J. 1979, A&A, 74, 73 [NASA ADS] [Google Scholar]
- Sawala, T., Guo, Q., Scannapieco, C., Jenkins, A., & White, S. 2011, MNRAS, 413, 659 [NASA ADS] [CrossRef] [Google Scholar]
- Scannapieco, E., & Brüggen, M. 2010, MNRAS, 405, 1634 [NASA ADS] [Google Scholar]
- Schaye, J., & Dalla Vecchia, C. 2008, MNRAS, 383, 1210 [NASA ADS] [CrossRef] [EDP Sciences] [Google Scholar]
- Schroyen, J., de Rijcke, S., Valcke, S., Cloet-Osselaer, A., & Dejonghe, H. 2011, MNRAS, 416, 601 [NASA ADS] [Google Scholar]
- Silich, S., & Tenoreo-Tagle, G. 2001, ApJ, 552, 91 [NASA ADS] [CrossRef] [Google Scholar]
- Spekkens, K., Giovanelli, R., & Haynes, M. P. 2005, AJ, 129, 2119 [NASA ADS] [CrossRef] [Google Scholar]
- Spergel, D. N., Verde, L. L., Peiris, H. V., et al. 2003, ApJS, 148, 175 [NASA ADS] [CrossRef] [Google Scholar]
- Springel, V., & Hernquist, L. 2003, MNRAS, 339, 289 [Google Scholar]
- Stone, J. M., & Norman, M. L. 1992, ApJSS, 80, 753 [NASA ADS] [CrossRef] [Google Scholar]
- Strickland, D. K., & Stevens, I. R. 2000, MNRAS, 314, 511 [NASA ADS] [CrossRef] [Google Scholar]
- Suchkov, A. A., Balsara, D. S., Heckman, T. M., & Leitherer, C. 1994, ApJ, 430, 511 [NASA ADS] [CrossRef] [Google Scholar]
- Swaters, R. A., Sancisi, R., van Albada, T. S., & van der Hulst, J. M. 2009, A&A, 493, 872 [Google Scholar]
- Swaters, R. A., Sancisi, R., van Albada, T. S., & van der Hulst, J. M. 2011, ApJ, 729, 118 [NASA ADS] [CrossRef] [Google Scholar]
- Takeuchi, T. T., Hirashita, H., Ishii, T. T., Hunt, L. K., & Ferrara, A. 2003, A&A, 343, 839 [Google Scholar]
- Tasker, E. J. 2011, ApJ, 730, 11 [NASA ADS] [CrossRef] [Google Scholar]
- Tassoul, J. L. 1978, Theory of rotating stars (Princeton University Press) [Google Scholar]
- Thomas, D., Maraston, C., Bender, R., & Mendes de Oliveira, C. 2005, ApJ, 621, 673 [NASA ADS] [CrossRef] [Google Scholar]
- Toloba, E., Boselli, A., Cenarro, A. J., et al. 2011, A&A, 526, A114 [NASA ADS] [CrossRef] [EDP Sciences] [Google Scholar]
- Tomisaka, K., & Ikeuchi, S. 1988, ApJ, 330, 695 [NASA ADS] [CrossRef] [Google Scholar]
- Toomre, A. 1964, ApJ, 139, 1217 [NASA ADS] [CrossRef] [Google Scholar]
- Vasiliev, E. O., Vorobyov, E. I., & Shchekinov, Yu. A. 2008, A&A, 489, 505 [NASA ADS] [CrossRef] [EDP Sciences] [Google Scholar]
- Vorobyov, E. I. 2003, A&A, 407, 913 [NASA ADS] [CrossRef] [EDP Sciences] [Google Scholar]
- Vorobyov, E. I., & Basu, S. 2005, A&A, 431, 451 [NASA ADS] [CrossRef] [EDP Sciences] [Google Scholar]
- Vorobyov, E. I., Klein, U., Shchekinov, Yu. A., & Ott, J. 2004, A&A, 413, 939 [NASA ADS] [CrossRef] [EDP Sciences] [Google Scholar]
- van Zee, L., Westpfahl, D., Haynes, M. P., & Salzer, J. J. 1998, AJ, 115, 1000 [NASA ADS] [CrossRef] [Google Scholar]
All Tables
All Figures
|
Fig. 1 Schematic representation of the iterative solution procedure to calculate rotating, self-gravitating gaseous equilibria in DM halos. |
| In the text | |
|
Fig. 2 Gas surface densities (left column), Toomre Q parameters (middle column), and rotation velocities (right column) of self-gravitating (steady-state) gaseous disk hosted by quasi-isothermal DM halos with four masses MDM as indicated in the right-hand column. The spatially uniform gas temperature and the spin parameter are set to Tg = 104 K and α = 0.9, respectively. The horizontal dotted lines mark the adopted critical surface density for star formation Σc = 5 M⊙ pc2 (left column) and the critical Toomre parameter Qcr for gravitational stability (middle column). For every value of MDM, five models with different values of the seed density n0,0 = 25.0, 5.0, 1.0, 0.1, and 0.01 cm-3 from the uppermost to the lowermost line are considered. Higher n0,0 produce models with higher gas surface densities in the inner regions. The models that are susceptible to star formation according to the adopted star formation criteria are marked with red thick lines and the gas mass |
| In the text | |
|
Fig. 3 Total gas masses Mg calculated for five models with different seed density values n0,0. The filled squares mark the models that are susceptible to star formation according to the adopted criteria. Lines of different style connect models with equal masses of the DM halo. |
| In the text | |
|
Fig. 4 Top. Minimum gas mass for star formation |
| In the text | |
|
Fig. 5 Same as Fig. 2 for the gas temperature |
| In the text | |
|
Fig. 6 Comparison of the gas surface density profiles for models with the spin parameter α = 0.5 (solid lines) and α = 0.9 (dashed lines). The DM halo mass MDM and the gas temperature Tg are indicated in every panel. The gas mass |
| In the text | |
|
Fig. 7 Top. Minimum gas mass for star formation |
| In the text | |
|
Fig. 8 Left column. Comparison of the gas surface density in the reference model (dashed lines) with that of the zgf = 2.0 model (solid lines). The dotted line marks the critical surface density for star formation Σc = 5 M⊙ pc-2. Gas temperature is indicated in every panel and the DM halo mass is shown in the corresponding panels on the right. The gas mass |
| In the text | |
|
Fig. 9 Top. Effect of changing the zero-point of the |
| In the text | |
|
Fig. 10 Comparison of the gas volume density profiles along the r-axis (left column) and z-axis (right column). In particular, models in the top row are characterized by different gas temperatures Tg (as indicated), the second top row by different spin parameters α, the third top row by different effective gas dispersions σeff, and the bottom row by different redshift for galaxy formation zgf. All other parameters for every model are the same (see text for more details). |
| In the text | |
|
Fig. A.1 Computational domain in the (r,z) plane showing active and ghost grid zones with solid and dashed lines, respectively. The zone centers are marked with filled/open circles for active/ghost zones. The arrows indicate the backward finite-difference scheme used to discretize spatial derivatives. The innermost grid cell highlighted with a backslash palette refers to the seed value of the gas surface density n0,0. |
| In the text | |
|
Fig. B.1 Maximum and mean relative errors (dashed and solid lines, respectively) in the gas volume density (top) as functions of time t for the reference test model described in Appendix B. The errors are calculated relative to the initial equilibrium configuration at t = 0 Myr. The dash-dotted lines show the relative errors in the absence of gas self-gravity. |
| In the text | |
Current usage metrics show cumulative count of Article Views (full-text article views including HTML views, PDF and ePub downloads, according to the available data) and Abstracts Views on Vision4Press platform.
Data correspond to usage on the plateform after 2015. The current usage metrics is available 48-96 hours after online publication and is updated daily on week days.
Initial download of the metrics may take a while.